Immigrants from Peru vs Trinidadian and Tobagonian 10th Grade
COMPARE
Immigrants from Peru
Trinidadian and Tobagonian
10th Grade
10th Grade Comparison
Immigrants from Peru
Trinidadians and Tobagonians
92.2%
10TH GRADE
0.1/ 100
METRIC RATING
282nd/ 347
METRIC RANK
92.4%
10TH GRADE
0.2/ 100
METRIC RATING
273rd/ 347
METRIC RANK
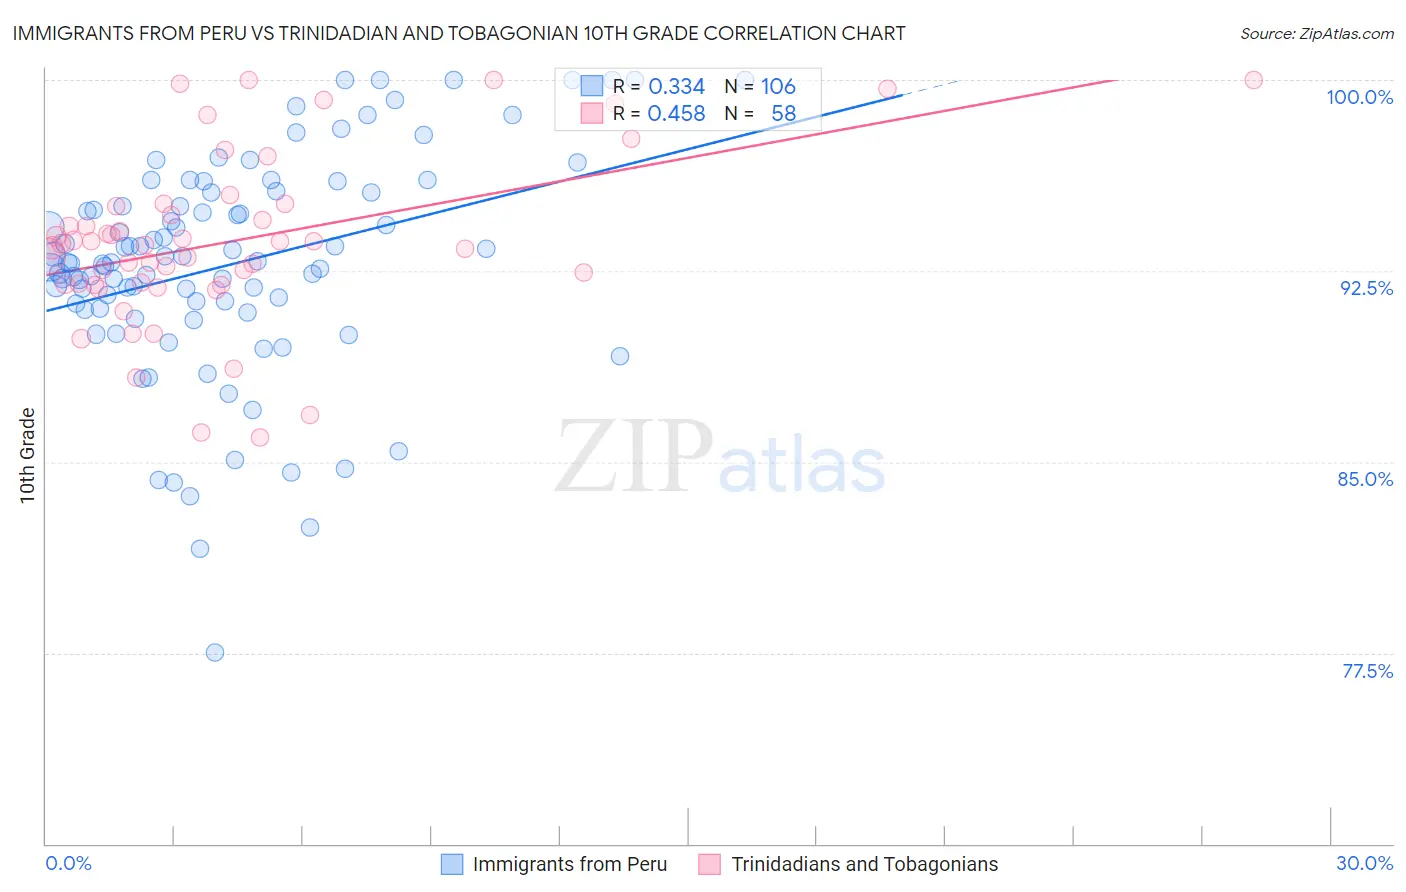
Immigrants from Peru vs Trinidadian and Tobagonian 10th Grade Correlation Chart
The statistical analysis conducted on geographies consisting of 328,860,880 people shows a mild positive correlation between the proportion of Immigrants from Peru and percentage of population with at least 10th grade education in the United States with a correlation coefficient (R) of 0.334 and weighted average of 92.2%. Similarly, the statistical analysis conducted on geographies consisting of 219,881,170 people shows a moderate positive correlation between the proportion of Trinidadians and Tobagonians and percentage of population with at least 10th grade education in the United States with a correlation coefficient (R) of 0.458 and weighted average of 92.4%, a difference of 0.31%.
10th Grade Correlation Summary
| Measurement | Immigrants from Peru | Trinidadian and Tobagonian |
| Minimum | 77.5% | 86.0% |
| Maximum | 100.0% | 100.0% |
| Range | 22.5% | 14.0% |
| Mean | 92.8% | 93.7% |
| Median | 92.8% | 93.5% |
| Interquartile 25% (IQ1) | 91.0% | 92.0% |
| Interquartile 75% (IQ3) | 95.6% | 95.0% |
| Interquartile Range (IQR) | 4.6% | 3.1% |
| Standard Deviation (Sample) | 4.3% | 3.3% |
| Standard Deviation (Population) | 4.3% | 3.3% |
Demographics Similar to Immigrants from Peru and Trinidadians and Tobagonians by 10th Grade
In terms of 10th grade, the demographic groups most similar to Immigrants from Peru are Bangladeshi (92.2%, a difference of 0.020%), Malaysian (92.2%, a difference of 0.030%), Barbadian (92.2%, a difference of 0.060%), Native/Alaskan (92.2%, a difference of 0.060%), and Immigrants from St. Vincent and the Grenadines (92.1%, a difference of 0.060%). Similarly, the demographic groups most similar to Trinidadians and Tobagonians are Immigrants from Congo (92.4%, a difference of 0.010%), West Indian (92.4%, a difference of 0.010%), Immigrants from Western Africa (92.5%, a difference of 0.070%), Immigrants from Eritrea (92.5%, a difference of 0.080%), and Immigrants from Colombia (92.5%, a difference of 0.090%).
| Demographics | Rating | Rank | 10th Grade |
| Taiwanese | 0.3 /100 | #267 | Tragic 92.5% |
| Immigrants | Ghana | 0.3 /100 | #268 | Tragic 92.5% |
| Immigrants | Colombia | 0.3 /100 | #269 | Tragic 92.5% |
| Immigrants | Uruguay | 0.3 /100 | #270 | Tragic 92.5% |
| Immigrants | Eritrea | 0.3 /100 | #271 | Tragic 92.5% |
| Immigrants | Western Africa | 0.3 /100 | #272 | Tragic 92.5% |
| Trinidadians and Tobagonians | 0.2 /100 | #273 | Tragic 92.4% |
| Immigrants | Congo | 0.2 /100 | #274 | Tragic 92.4% |
| West Indians | 0.2 /100 | #275 | Tragic 92.4% |
| Immigrants | Trinidad and Tobago | 0.1 /100 | #276 | Tragic 92.3% |
| Navajo | 0.1 /100 | #277 | Tragic 92.3% |
| Barbadians | 0.1 /100 | #278 | Tragic 92.2% |
| Natives/Alaskans | 0.1 /100 | #279 | Tragic 92.2% |
| Malaysians | 0.1 /100 | #280 | Tragic 92.2% |
| Bangladeshis | 0.1 /100 | #281 | Tragic 92.2% |
| Immigrants | Peru | 0.1 /100 | #282 | Tragic 92.2% |
| Immigrants | St. Vincent and the Grenadines | 0.0 /100 | #283 | Tragic 92.1% |
| Immigrants | Barbados | 0.0 /100 | #284 | Tragic 92.1% |
| Immigrants | South Eastern Asia | 0.0 /100 | #285 | Tragic 92.1% |
| Yuman | 0.0 /100 | #286 | Tragic 92.0% |
| Pennsylvania Germans | 0.0 /100 | #287 | Tragic 91.9% |