Mexican vs Marshallese 10th Grade
COMPARE
Mexican
Marshallese
10th Grade
10th Grade Comparison
Mexicans
Marshallese
87.8%
10TH GRADE
0.0/ 100
METRIC RATING
340th/ 347
METRIC RANK
93.6%
10TH GRADE
33.2/ 100
METRIC RATING
188th/ 347
METRIC RANK
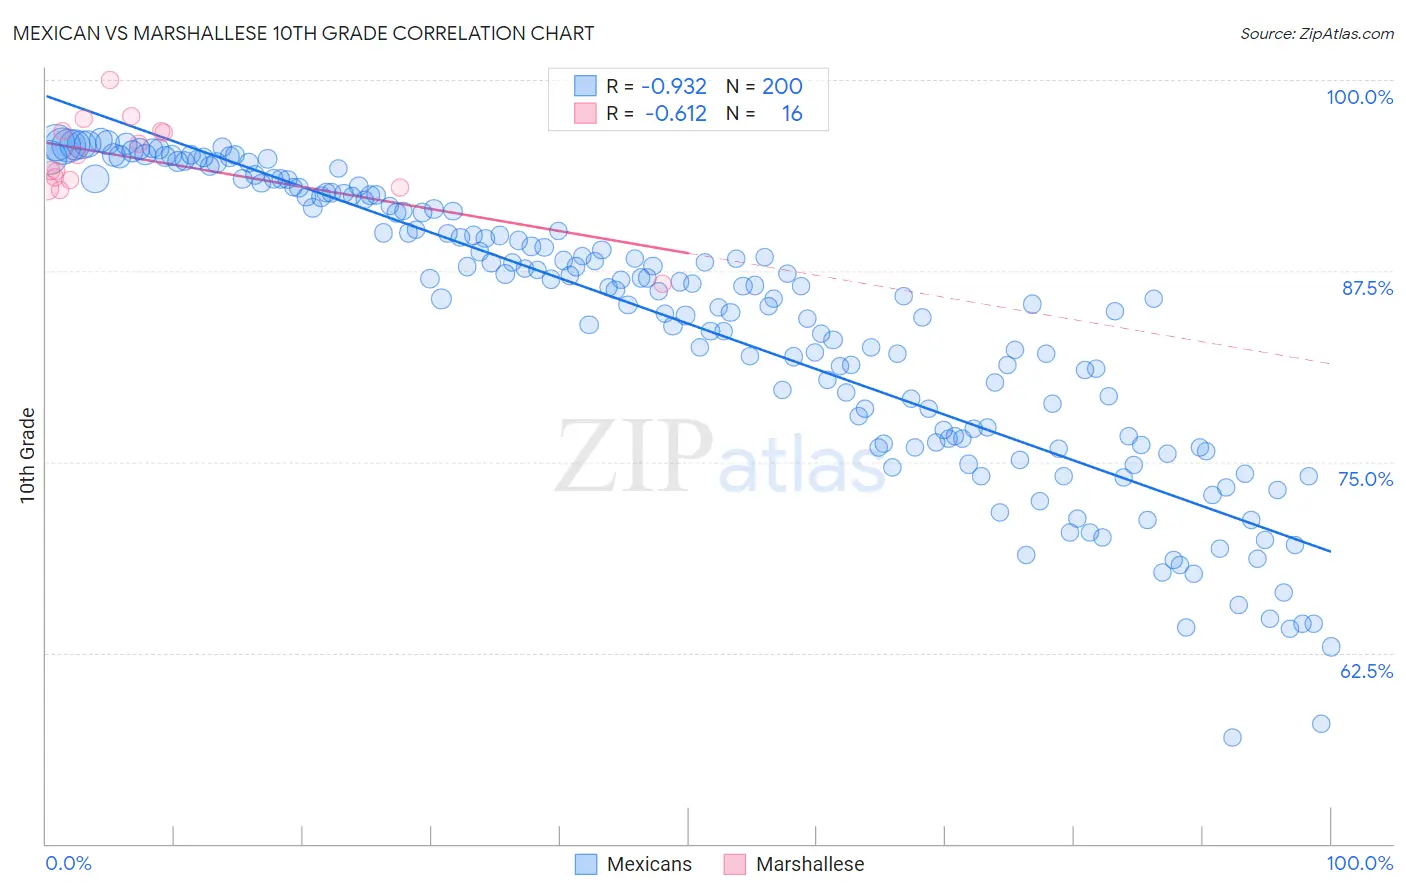
Mexican vs Marshallese 10th Grade Correlation Chart
The statistical analysis conducted on geographies consisting of 565,338,990 people shows a near-perfect negative correlation between the proportion of Mexicans and percentage of population with at least 10th grade education in the United States with a correlation coefficient (R) of -0.932 and weighted average of 87.8%. Similarly, the statistical analysis conducted on geographies consisting of 14,761,315 people shows a significant negative correlation between the proportion of Marshallese and percentage of population with at least 10th grade education in the United States with a correlation coefficient (R) of -0.612 and weighted average of 93.6%, a difference of 6.6%.
10th Grade Correlation Summary
| Measurement | Mexican | Marshallese |
| Minimum | 57.0% | 86.6% |
| Maximum | 96.1% | 100.0% |
| Range | 39.1% | 13.4% |
| Mean | 84.0% | 94.8% |
| Median | 86.3% | 94.6% |
| Interquartile 25% (IQ1) | 76.6% | 93.2% |
| Interquartile 75% (IQ3) | 92.3% | 96.6% |
| Interquartile Range (IQR) | 15.7% | 3.4% |
| Standard Deviation (Sample) | 9.3% | 3.0% |
| Standard Deviation (Population) | 9.2% | 2.9% |
Similar Demographics by 10th Grade
Demographics Similar to Mexicans by 10th Grade
In terms of 10th grade, the demographic groups most similar to Mexicans are Guatemalan (87.9%, a difference of 0.16%), Salvadoran (87.5%, a difference of 0.29%), Immigrants from Guatemala (87.4%, a difference of 0.44%), Immigrants from Latin America (88.3%, a difference of 0.65%), and Central American (88.4%, a difference of 0.71%).
| Demographics | Rating | Rank | 10th Grade |
| Hondurans | 0.0 /100 | #333 | Tragic 89.0% |
| Hispanics or Latinos | 0.0 /100 | #334 | Tragic 88.9% |
| Immigrants | Dominican Republic | 0.0 /100 | #335 | Tragic 88.7% |
| Immigrants | Honduras | 0.0 /100 | #336 | Tragic 88.5% |
| Central Americans | 0.0 /100 | #337 | Tragic 88.4% |
| Immigrants | Latin America | 0.0 /100 | #338 | Tragic 88.3% |
| Guatemalans | 0.0 /100 | #339 | Tragic 87.9% |
| Mexicans | 0.0 /100 | #340 | Tragic 87.8% |
| Salvadorans | 0.0 /100 | #341 | Tragic 87.5% |
| Immigrants | Guatemala | 0.0 /100 | #342 | Tragic 87.4% |
| Yakama | 0.0 /100 | #343 | Tragic 86.9% |
| Immigrants | El Salvador | 0.0 /100 | #344 | Tragic 86.8% |
| Immigrants | Central America | 0.0 /100 | #345 | Tragic 86.6% |
| Spanish American Indians | 0.0 /100 | #346 | Tragic 86.2% |
| Immigrants | Mexico | 0.0 /100 | #347 | Tragic 86.2% |
Demographics Similar to Marshallese by 10th Grade
In terms of 10th grade, the demographic groups most similar to Marshallese are Immigrants from Pakistan (93.6%, a difference of 0.010%), Laotian (93.6%, a difference of 0.010%), Immigrants from Eastern Asia (93.6%, a difference of 0.020%), Liberian (93.6%, a difference of 0.020%), and Yup'ik (93.6%, a difference of 0.020%).
| Demographics | Rating | Rank | 10th Grade |
| Immigrants | Northern Africa | 41.6 /100 | #181 | Average 93.7% |
| Colville | 38.8 /100 | #182 | Fair 93.6% |
| Guamanians/Chamorros | 37.1 /100 | #183 | Fair 93.6% |
| Choctaw | 36.6 /100 | #184 | Fair 93.6% |
| Sudanese | 36.6 /100 | #185 | Fair 93.6% |
| Immigrants | Eastern Asia | 35.1 /100 | #186 | Fair 93.6% |
| Liberians | 34.7 /100 | #187 | Fair 93.6% |
| Marshallese | 33.2 /100 | #188 | Fair 93.6% |
| Immigrants | Pakistan | 32.5 /100 | #189 | Fair 93.6% |
| Laotians | 32.1 /100 | #190 | Fair 93.6% |
| Yup'ik | 31.1 /100 | #191 | Fair 93.6% |
| Immigrants | Malaysia | 28.0 /100 | #192 | Fair 93.5% |
| Panamanians | 28.0 /100 | #193 | Fair 93.5% |
| Immigrants | Morocco | 26.9 /100 | #194 | Fair 93.5% |
| Cheyenne | 26.8 /100 | #195 | Fair 93.5% |