Menominee vs Immigrants from Caribbean Master's Degree
COMPARE
Menominee
Immigrants from Caribbean
Master's Degree
Master's Degree Comparison
Menominee
Immigrants from Caribbean
10.2%
MASTER'S DEGREE
0.0/ 100
METRIC RATING
333rd/ 347
METRIC RANK
12.1%
MASTER'S DEGREE
0.3/ 100
METRIC RATING
277th/ 347
METRIC RANK
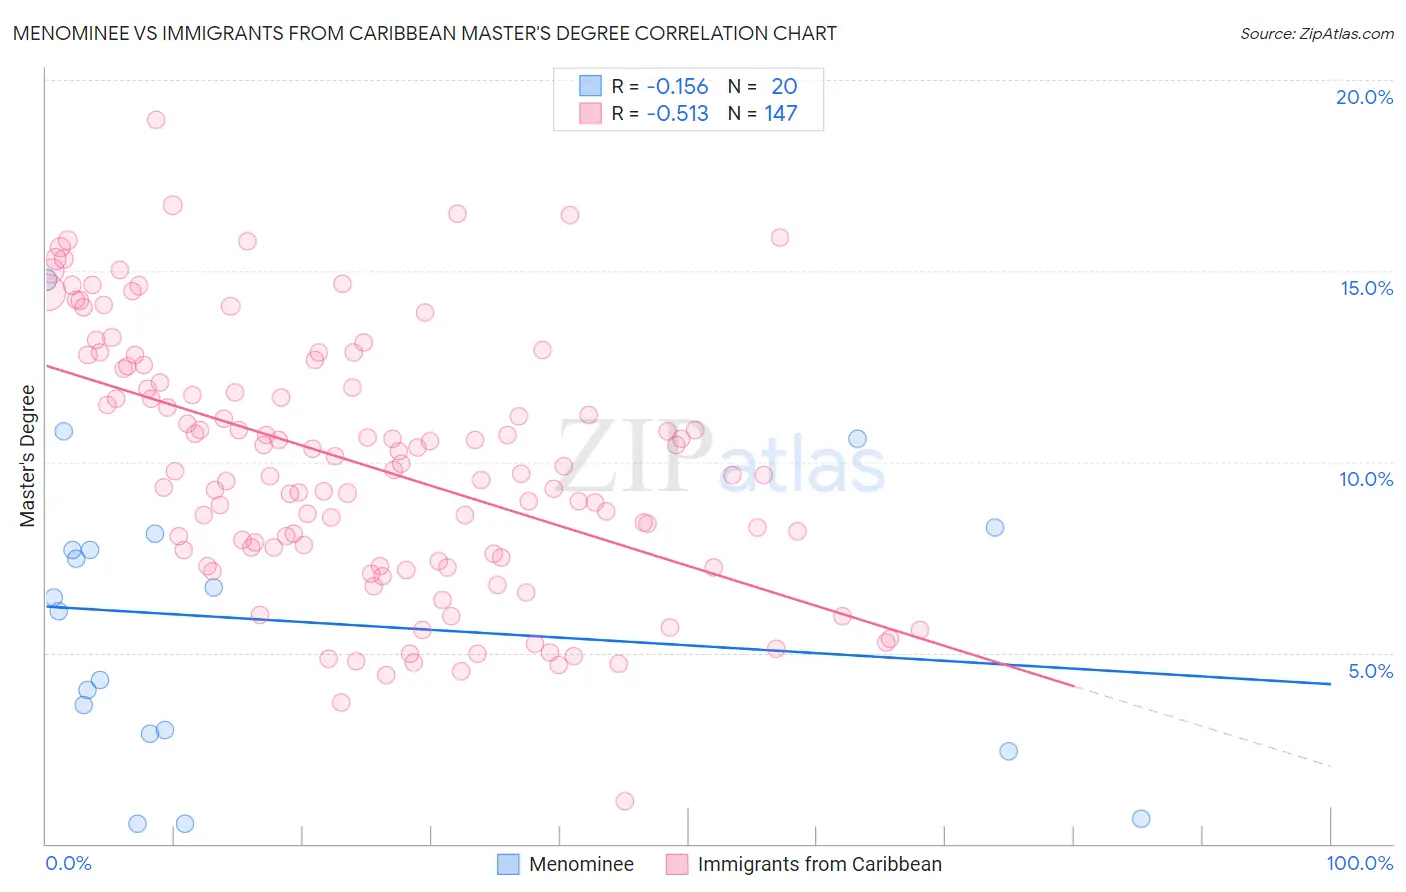
Menominee vs Immigrants from Caribbean Master's Degree Correlation Chart
The statistical analysis conducted on geographies consisting of 45,774,171 people shows a poor negative correlation between the proportion of Menominee and percentage of population with at least master's degree education in the United States with a correlation coefficient (R) of -0.156 and weighted average of 10.2%. Similarly, the statistical analysis conducted on geographies consisting of 449,853,344 people shows a substantial negative correlation between the proportion of Immigrants from Caribbean and percentage of population with at least master's degree education in the United States with a correlation coefficient (R) of -0.513 and weighted average of 12.1%, a difference of 18.4%.
Master's Degree Correlation Summary
| Measurement | Menominee | Immigrants from Caribbean |
| Minimum | 0.53% | 1.1% |
| Maximum | 14.8% | 18.9% |
| Range | 14.2% | 17.8% |
| Mean | 5.8% | 9.9% |
| Median | 6.3% | 9.7% |
| Interquartile 25% (IQ1) | 2.9% | 7.5% |
| Interquartile 75% (IQ3) | 7.9% | 12.4% |
| Interquartile Range (IQR) | 5.0% | 4.9% |
| Standard Deviation (Sample) | 3.8% | 3.3% |
| Standard Deviation (Population) | 3.7% | 3.3% |
Similar Demographics by Master's Degree
Demographics Similar to Menominee by Master's Degree
In terms of master's degree, the demographic groups most similar to Menominee are Immigrants from the Azores (10.2%, a difference of 0.37%), Pueblo (10.3%, a difference of 0.83%), Fijian (10.3%, a difference of 1.0%), Arapaho (10.0%, a difference of 1.9%), and Immigrants from Central America (10.0%, a difference of 2.1%).
| Demographics | Rating | Rank | Master's Degree |
| Creek | 0.0 /100 | #326 | Tragic 10.5% |
| Paiute | 0.0 /100 | #327 | Tragic 10.5% |
| Bangladeshis | 0.0 /100 | #328 | Tragic 10.5% |
| Nepalese | 0.0 /100 | #329 | Tragic 10.5% |
| Fijians | 0.0 /100 | #330 | Tragic 10.3% |
| Pueblo | 0.0 /100 | #331 | Tragic 10.3% |
| Immigrants | Azores | 0.0 /100 | #332 | Tragic 10.2% |
| Menominee | 0.0 /100 | #333 | Tragic 10.2% |
| Arapaho | 0.0 /100 | #334 | Tragic 10.0% |
| Immigrants | Central America | 0.0 /100 | #335 | Tragic 10.0% |
| Natives/Alaskans | 0.0 /100 | #336 | Tragic 9.9% |
| Mexicans | 0.0 /100 | #337 | Tragic 9.7% |
| Tohono O'odham | 0.0 /100 | #338 | Tragic 9.7% |
| Spanish American Indians | 0.0 /100 | #339 | Tragic 9.6% |
| Yakama | 0.0 /100 | #340 | Tragic 9.5% |
Demographics Similar to Immigrants from Caribbean by Master's Degree
In terms of master's degree, the demographic groups most similar to Immigrants from Caribbean are Potawatomi (12.1%, a difference of 0.0%), Black/African American (12.1%, a difference of 0.010%), Cuban (12.1%, a difference of 0.060%), Cape Verdean (12.1%, a difference of 0.080%), and Immigrants from Belize (12.1%, a difference of 0.080%).
| Demographics | Rating | Rank | Master's Degree |
| Salvadorans | 0.3 /100 | #270 | Tragic 12.2% |
| Haitians | 0.3 /100 | #271 | Tragic 12.1% |
| Comanche | 0.3 /100 | #272 | Tragic 12.1% |
| Blackfeet | 0.3 /100 | #273 | Tragic 12.1% |
| Cape Verdeans | 0.3 /100 | #274 | Tragic 12.1% |
| Cubans | 0.3 /100 | #275 | Tragic 12.1% |
| Blacks/African Americans | 0.3 /100 | #276 | Tragic 12.1% |
| Immigrants | Caribbean | 0.3 /100 | #277 | Tragic 12.1% |
| Potawatomi | 0.3 /100 | #278 | Tragic 12.1% |
| Immigrants | Belize | 0.2 /100 | #279 | Tragic 12.1% |
| Immigrants | Dominican Republic | 0.2 /100 | #280 | Tragic 12.1% |
| Malaysians | 0.2 /100 | #281 | Tragic 12.0% |
| Immigrants | El Salvador | 0.2 /100 | #282 | Tragic 12.0% |
| Hondurans | 0.2 /100 | #283 | Tragic 11.9% |
| Ottawa | 0.2 /100 | #284 | Tragic 11.9% |