Menominee vs Immigrants from Western Asia Master's Degree
COMPARE
Menominee
Immigrants from Western Asia
Master's Degree
Master's Degree Comparison
Menominee
Immigrants from Western Asia
10.2%
MASTER'S DEGREE
0.0/ 100
METRIC RATING
333rd/ 347
METRIC RANK
17.5%
MASTER'S DEGREE
99.5/ 100
METRIC RATING
81st/ 347
METRIC RANK
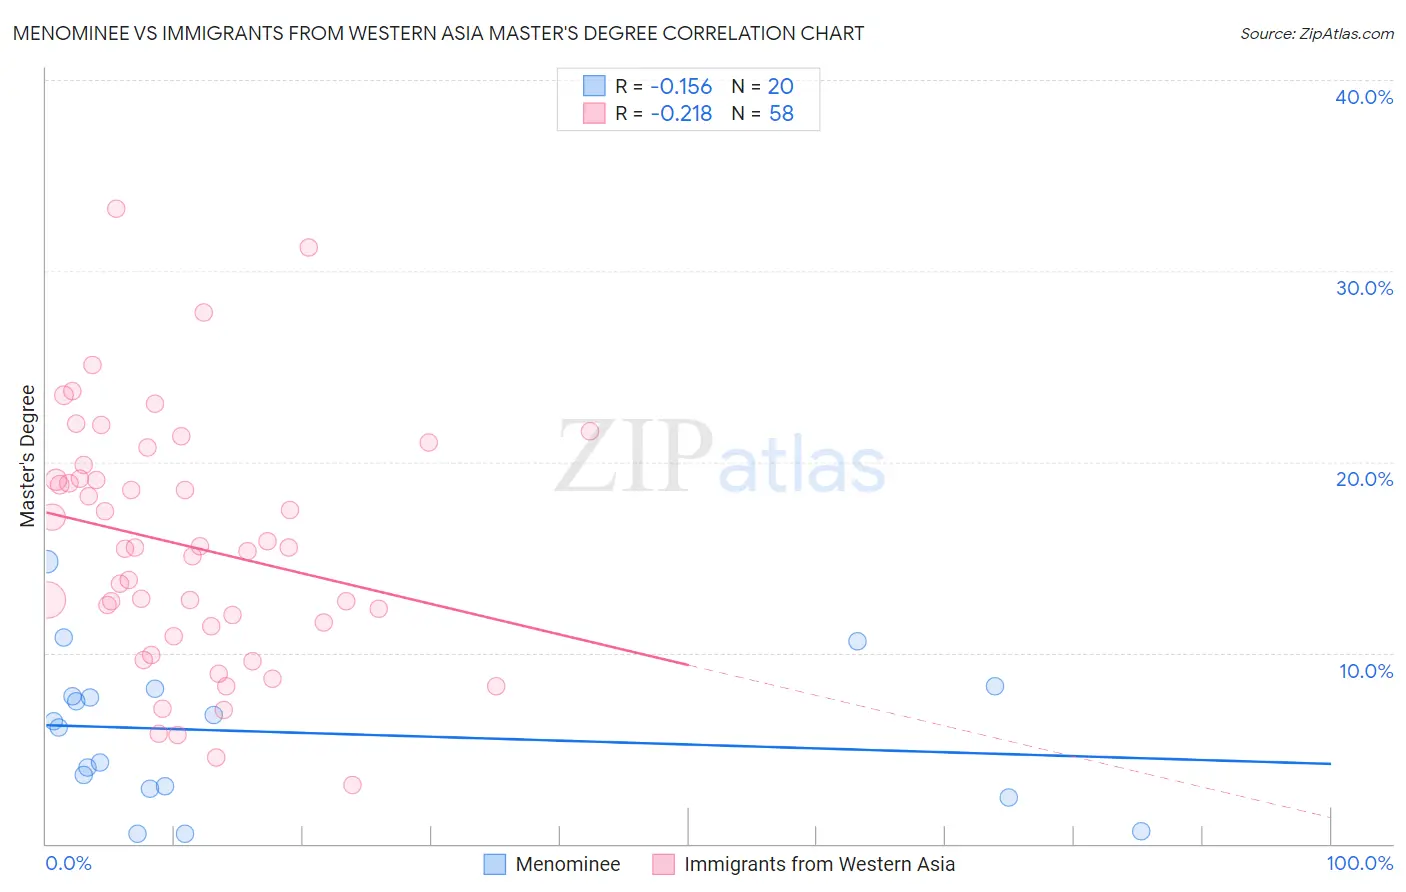
Menominee vs Immigrants from Western Asia Master's Degree Correlation Chart
The statistical analysis conducted on geographies consisting of 45,774,171 people shows a poor negative correlation between the proportion of Menominee and percentage of population with at least master's degree education in the United States with a correlation coefficient (R) of -0.156 and weighted average of 10.2%. Similarly, the statistical analysis conducted on geographies consisting of 404,328,411 people shows a weak negative correlation between the proportion of Immigrants from Western Asia and percentage of population with at least master's degree education in the United States with a correlation coefficient (R) of -0.218 and weighted average of 17.5%, a difference of 71.3%.
Master's Degree Correlation Summary
| Measurement | Menominee | Immigrants from Western Asia |
| Minimum | 0.53% | 3.1% |
| Maximum | 14.8% | 33.2% |
| Range | 14.2% | 30.2% |
| Mean | 5.8% | 15.6% |
| Median | 6.3% | 15.5% |
| Interquartile 25% (IQ1) | 2.9% | 11.4% |
| Interquartile 75% (IQ3) | 7.9% | 19.1% |
| Interquartile Range (IQR) | 5.0% | 7.8% |
| Standard Deviation (Sample) | 3.8% | 6.4% |
| Standard Deviation (Population) | 3.7% | 6.4% |
Similar Demographics by Master's Degree
Demographics Similar to Menominee by Master's Degree
In terms of master's degree, the demographic groups most similar to Menominee are Immigrants from the Azores (10.2%, a difference of 0.37%), Pueblo (10.3%, a difference of 0.83%), Fijian (10.3%, a difference of 1.0%), Arapaho (10.0%, a difference of 1.9%), and Immigrants from Central America (10.0%, a difference of 2.1%).
| Demographics | Rating | Rank | Master's Degree |
| Creek | 0.0 /100 | #326 | Tragic 10.5% |
| Paiute | 0.0 /100 | #327 | Tragic 10.5% |
| Bangladeshis | 0.0 /100 | #328 | Tragic 10.5% |
| Nepalese | 0.0 /100 | #329 | Tragic 10.5% |
| Fijians | 0.0 /100 | #330 | Tragic 10.3% |
| Pueblo | 0.0 /100 | #331 | Tragic 10.3% |
| Immigrants | Azores | 0.0 /100 | #332 | Tragic 10.2% |
| Menominee | 0.0 /100 | #333 | Tragic 10.2% |
| Arapaho | 0.0 /100 | #334 | Tragic 10.0% |
| Immigrants | Central America | 0.0 /100 | #335 | Tragic 10.0% |
| Natives/Alaskans | 0.0 /100 | #336 | Tragic 9.9% |
| Mexicans | 0.0 /100 | #337 | Tragic 9.7% |
| Tohono O'odham | 0.0 /100 | #338 | Tragic 9.7% |
| Spanish American Indians | 0.0 /100 | #339 | Tragic 9.6% |
| Yakama | 0.0 /100 | #340 | Tragic 9.5% |
Demographics Similar to Immigrants from Western Asia by Master's Degree
In terms of master's degree, the demographic groups most similar to Immigrants from Western Asia are Greek (17.5%, a difference of 0.050%), Immigrants from Zimbabwe (17.4%, a difference of 0.11%), Carpatho Rusyn (17.5%, a difference of 0.30%), Immigrants from Lebanon (17.5%, a difference of 0.35%), and Immigrants from Scotland (17.4%, a difference of 0.44%).
| Demographics | Rating | Rank | Master's Degree |
| Immigrants | Romania | 99.7 /100 | #74 | Exceptional 17.7% |
| Egyptians | 99.6 /100 | #75 | Exceptional 17.6% |
| Immigrants | Indonesia | 99.6 /100 | #76 | Exceptional 17.6% |
| Immigrants | Eastern Europe | 99.6 /100 | #77 | Exceptional 17.6% |
| Immigrants | Hungary | 99.6 /100 | #78 | Exceptional 17.5% |
| Immigrants | Lebanon | 99.6 /100 | #79 | Exceptional 17.5% |
| Carpatho Rusyns | 99.6 /100 | #80 | Exceptional 17.5% |
| Immigrants | Western Asia | 99.5 /100 | #81 | Exceptional 17.5% |
| Greeks | 99.5 /100 | #82 | Exceptional 17.5% |
| Immigrants | Zimbabwe | 99.5 /100 | #83 | Exceptional 17.4% |
| Immigrants | Scotland | 99.4 /100 | #84 | Exceptional 17.4% |
| Immigrants | Brazil | 99.4 /100 | #85 | Exceptional 17.4% |
| Immigrants | Croatia | 99.3 /100 | #86 | Exceptional 17.3% |
| Maltese | 99.3 /100 | #87 | Exceptional 17.3% |
| Immigrants | Canada | 99.2 /100 | #88 | Exceptional 17.2% |