Menominee vs Cherokee Master's Degree
COMPARE
Menominee
Cherokee
Master's Degree
Master's Degree Comparison
Menominee
Cherokee
10.2%
MASTER'S DEGREE
0.0/ 100
METRIC RATING
333rd/ 347
METRIC RANK
11.4%
MASTER'S DEGREE
0.1/ 100
METRIC RATING
302nd/ 347
METRIC RANK
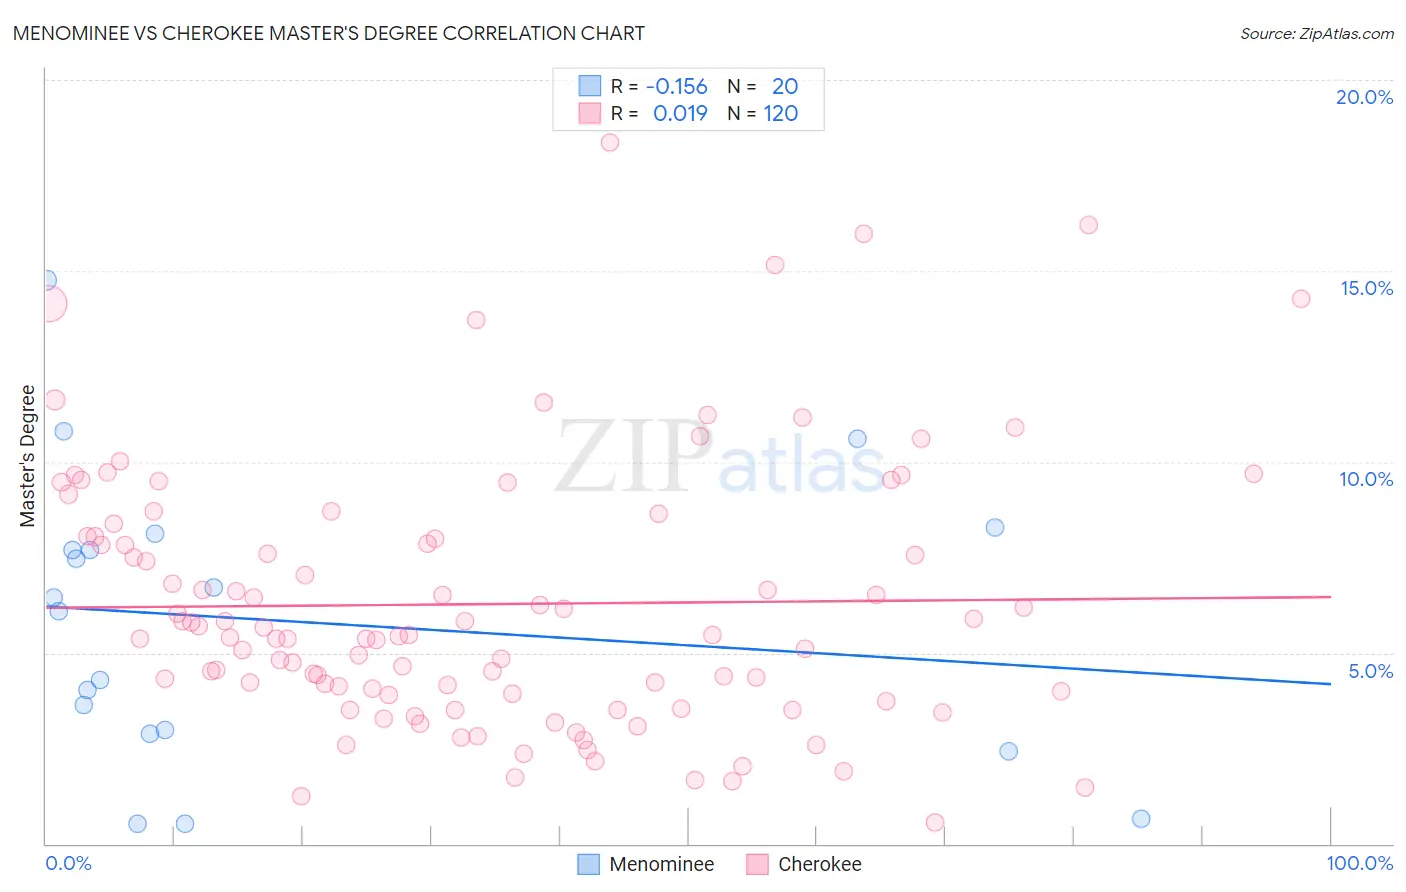
Menominee vs Cherokee Master's Degree Correlation Chart
The statistical analysis conducted on geographies consisting of 45,774,171 people shows a poor negative correlation between the proportion of Menominee and percentage of population with at least master's degree education in the United States with a correlation coefficient (R) of -0.156 and weighted average of 10.2%. Similarly, the statistical analysis conducted on geographies consisting of 493,264,146 people shows no correlation between the proportion of Cherokee and percentage of population with at least master's degree education in the United States with a correlation coefficient (R) of 0.019 and weighted average of 11.4%, a difference of 11.5%.
Master's Degree Correlation Summary
| Measurement | Menominee | Cherokee |
| Minimum | 0.53% | 0.55% |
| Maximum | 14.8% | 18.4% |
| Range | 14.2% | 17.8% |
| Mean | 5.8% | 6.3% |
| Median | 6.3% | 5.4% |
| Interquartile 25% (IQ1) | 2.9% | 3.9% |
| Interquartile 75% (IQ3) | 7.9% | 8.0% |
| Interquartile Range (IQR) | 5.0% | 4.1% |
| Standard Deviation (Sample) | 3.8% | 3.5% |
| Standard Deviation (Population) | 3.7% | 3.4% |
Similar Demographics by Master's Degree
Demographics Similar to Menominee by Master's Degree
In terms of master's degree, the demographic groups most similar to Menominee are Immigrants from the Azores (10.2%, a difference of 0.37%), Pueblo (10.3%, a difference of 0.83%), Fijian (10.3%, a difference of 1.0%), Arapaho (10.0%, a difference of 1.9%), and Immigrants from Central America (10.0%, a difference of 2.1%).
| Demographics | Rating | Rank | Master's Degree |
| Creek | 0.0 /100 | #326 | Tragic 10.5% |
| Paiute | 0.0 /100 | #327 | Tragic 10.5% |
| Bangladeshis | 0.0 /100 | #328 | Tragic 10.5% |
| Nepalese | 0.0 /100 | #329 | Tragic 10.5% |
| Fijians | 0.0 /100 | #330 | Tragic 10.3% |
| Pueblo | 0.0 /100 | #331 | Tragic 10.3% |
| Immigrants | Azores | 0.0 /100 | #332 | Tragic 10.2% |
| Menominee | 0.0 /100 | #333 | Tragic 10.2% |
| Arapaho | 0.0 /100 | #334 | Tragic 10.0% |
| Immigrants | Central America | 0.0 /100 | #335 | Tragic 10.0% |
| Natives/Alaskans | 0.0 /100 | #336 | Tragic 9.9% |
| Mexicans | 0.0 /100 | #337 | Tragic 9.7% |
| Tohono O'odham | 0.0 /100 | #338 | Tragic 9.7% |
| Spanish American Indians | 0.0 /100 | #339 | Tragic 9.6% |
| Yakama | 0.0 /100 | #340 | Tragic 9.5% |
Demographics Similar to Cherokee by Master's Degree
In terms of master's degree, the demographic groups most similar to Cherokee are Immigrants from Laos (11.4%, a difference of 0.020%), Immigrants from Cabo Verde (11.3%, a difference of 0.21%), Tsimshian (11.4%, a difference of 0.31%), Chippewa (11.4%, a difference of 0.47%), and Chickasaw (11.4%, a difference of 0.49%).
| Demographics | Rating | Rank | Master's Degree |
| Marshallese | 0.1 /100 | #295 | Tragic 11.6% |
| Alaskan Athabascans | 0.1 /100 | #296 | Tragic 11.6% |
| Immigrants | Yemen | 0.1 /100 | #297 | Tragic 11.6% |
| Samoans | 0.1 /100 | #298 | Tragic 11.5% |
| Chickasaw | 0.1 /100 | #299 | Tragic 11.4% |
| Chippewa | 0.1 /100 | #300 | Tragic 11.4% |
| Tsimshian | 0.1 /100 | #301 | Tragic 11.4% |
| Cherokee | 0.1 /100 | #302 | Tragic 11.4% |
| Immigrants | Laos | 0.1 /100 | #303 | Tragic 11.4% |
| Immigrants | Cabo Verde | 0.1 /100 | #304 | Tragic 11.3% |
| Immigrants | Latin America | 0.0 /100 | #305 | Tragic 11.3% |
| Mexican American Indians | 0.0 /100 | #306 | Tragic 11.2% |
| Cheyenne | 0.0 /100 | #307 | Tragic 11.2% |
| Puerto Ricans | 0.0 /100 | #308 | Tragic 11.2% |
| Puget Sound Salish | 0.0 /100 | #309 | Tragic 11.1% |