European vs Immigrants from Caribbean Master's Degree
COMPARE
European
Immigrants from Caribbean
Master's Degree
Master's Degree Comparison
Europeans
Immigrants from Caribbean
15.8%
MASTER'S DEGREE
86.4/ 100
METRIC RATING
137th/ 347
METRIC RANK
12.1%
MASTER'S DEGREE
0.3/ 100
METRIC RATING
277th/ 347
METRIC RANK
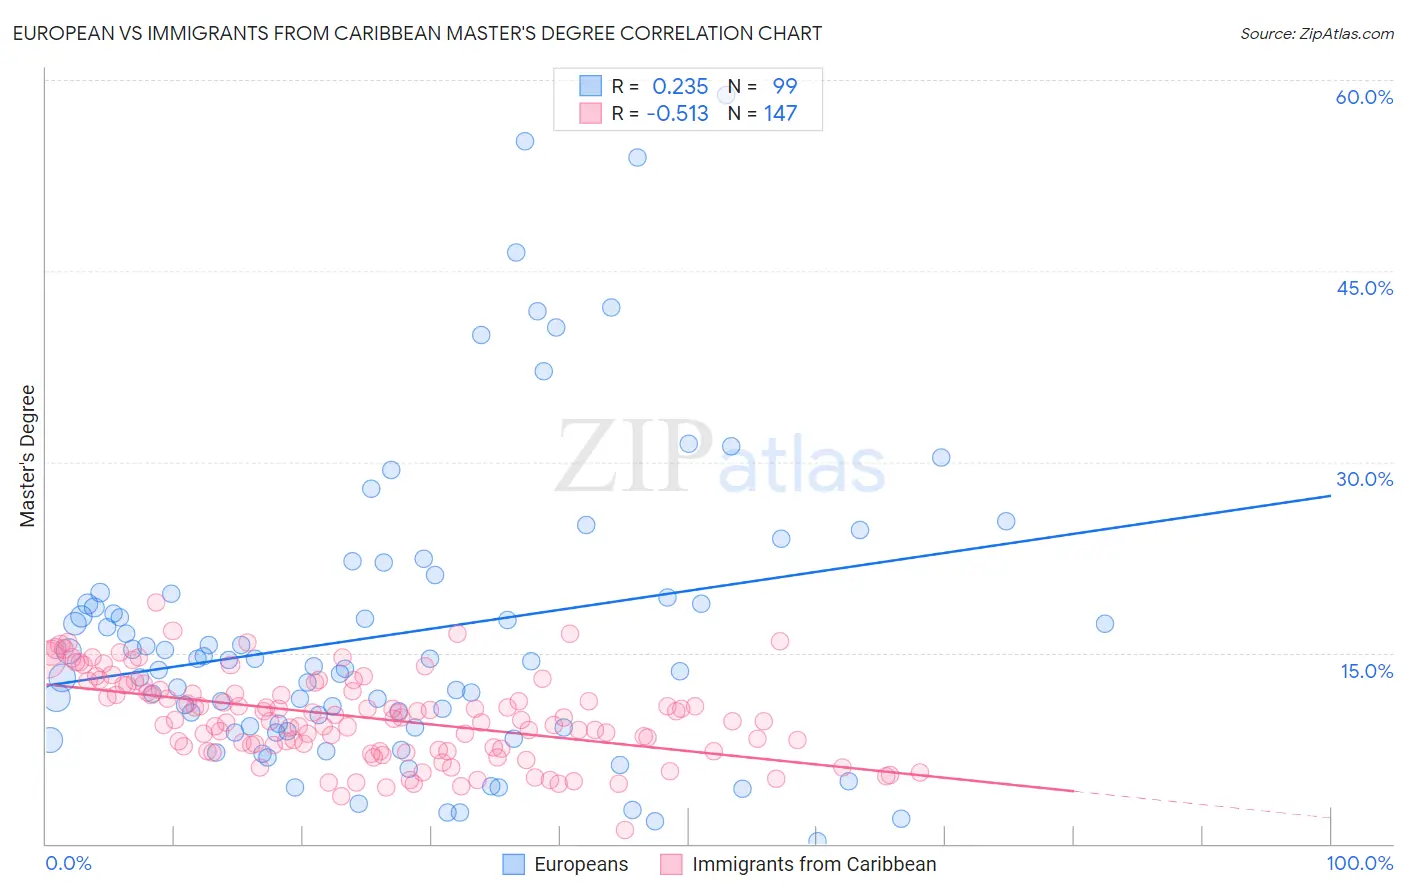
European vs Immigrants from Caribbean Master's Degree Correlation Chart
The statistical analysis conducted on geographies consisting of 561,170,396 people shows a weak positive correlation between the proportion of Europeans and percentage of population with at least master's degree education in the United States with a correlation coefficient (R) of 0.235 and weighted average of 15.8%. Similarly, the statistical analysis conducted on geographies consisting of 449,853,344 people shows a substantial negative correlation between the proportion of Immigrants from Caribbean and percentage of population with at least master's degree education in the United States with a correlation coefficient (R) of -0.513 and weighted average of 12.1%, a difference of 31.0%.
Master's Degree Correlation Summary
| Measurement | European | Immigrants from Caribbean |
| Minimum | 0.22% | 1.1% |
| Maximum | 58.8% | 18.9% |
| Range | 58.6% | 17.8% |
| Mean | 16.5% | 9.9% |
| Median | 13.9% | 9.7% |
| Interquartile 25% (IQ1) | 9.1% | 7.5% |
| Interquartile 75% (IQ3) | 19.4% | 12.4% |
| Interquartile Range (IQR) | 10.3% | 4.9% |
| Standard Deviation (Sample) | 11.8% | 3.3% |
| Standard Deviation (Population) | 11.8% | 3.3% |
Similar Demographics by Master's Degree
Demographics Similar to Europeans by Master's Degree
In terms of master's degree, the demographic groups most similar to Europeans are Pakistani (15.8%, a difference of 0.080%), Assyrian/Chaldean/Syriac (15.8%, a difference of 0.10%), Immigrants from Germany (15.8%, a difference of 0.14%), Vietnamese (15.8%, a difference of 0.22%), and Polish (15.7%, a difference of 0.35%).
| Demographics | Rating | Rank | Master's Degree |
| Immigrants | Jordan | 92.7 /100 | #130 | Exceptional 16.1% |
| Taiwanese | 91.9 /100 | #131 | Exceptional 16.1% |
| Serbians | 91.7 /100 | #132 | Exceptional 16.1% |
| Immigrants | Sudan | 90.2 /100 | #133 | Exceptional 16.0% |
| Venezuelans | 88.4 /100 | #134 | Excellent 15.9% |
| South American Indians | 88.4 /100 | #135 | Excellent 15.9% |
| Assyrians/Chaldeans/Syriacs | 86.8 /100 | #136 | Excellent 15.8% |
| Europeans | 86.4 /100 | #137 | Excellent 15.8% |
| Pakistanis | 86.1 /100 | #138 | Excellent 15.8% |
| Immigrants | Germany | 85.9 /100 | #139 | Excellent 15.8% |
| Vietnamese | 85.5 /100 | #140 | Excellent 15.8% |
| Poles | 85.0 /100 | #141 | Excellent 15.7% |
| Immigrants | Africa | 84.0 /100 | #142 | Excellent 15.7% |
| Immigrants | Venezuela | 83.6 /100 | #143 | Excellent 15.7% |
| Canadians | 83.3 /100 | #144 | Excellent 15.7% |
Demographics Similar to Immigrants from Caribbean by Master's Degree
In terms of master's degree, the demographic groups most similar to Immigrants from Caribbean are Potawatomi (12.1%, a difference of 0.0%), Black/African American (12.1%, a difference of 0.010%), Cuban (12.1%, a difference of 0.060%), Cape Verdean (12.1%, a difference of 0.080%), and Immigrants from Belize (12.1%, a difference of 0.080%).
| Demographics | Rating | Rank | Master's Degree |
| Salvadorans | 0.3 /100 | #270 | Tragic 12.2% |
| Haitians | 0.3 /100 | #271 | Tragic 12.1% |
| Comanche | 0.3 /100 | #272 | Tragic 12.1% |
| Blackfeet | 0.3 /100 | #273 | Tragic 12.1% |
| Cape Verdeans | 0.3 /100 | #274 | Tragic 12.1% |
| Cubans | 0.3 /100 | #275 | Tragic 12.1% |
| Blacks/African Americans | 0.3 /100 | #276 | Tragic 12.1% |
| Immigrants | Caribbean | 0.3 /100 | #277 | Tragic 12.1% |
| Potawatomi | 0.3 /100 | #278 | Tragic 12.1% |
| Immigrants | Belize | 0.2 /100 | #279 | Tragic 12.1% |
| Immigrants | Dominican Republic | 0.2 /100 | #280 | Tragic 12.1% |
| Malaysians | 0.2 /100 | #281 | Tragic 12.0% |
| Immigrants | El Salvador | 0.2 /100 | #282 | Tragic 12.0% |
| Hondurans | 0.2 /100 | #283 | Tragic 11.9% |
| Ottawa | 0.2 /100 | #284 | Tragic 11.9% |