Chinese vs Immigrants from Caribbean Master's Degree
COMPARE
Chinese
Immigrants from Caribbean
Master's Degree
Master's Degree Comparison
Chinese
Immigrants from Caribbean
14.6%
MASTER'S DEGREE
32.5/ 100
METRIC RATING
194th/ 347
METRIC RANK
12.1%
MASTER'S DEGREE
0.3/ 100
METRIC RATING
277th/ 347
METRIC RANK
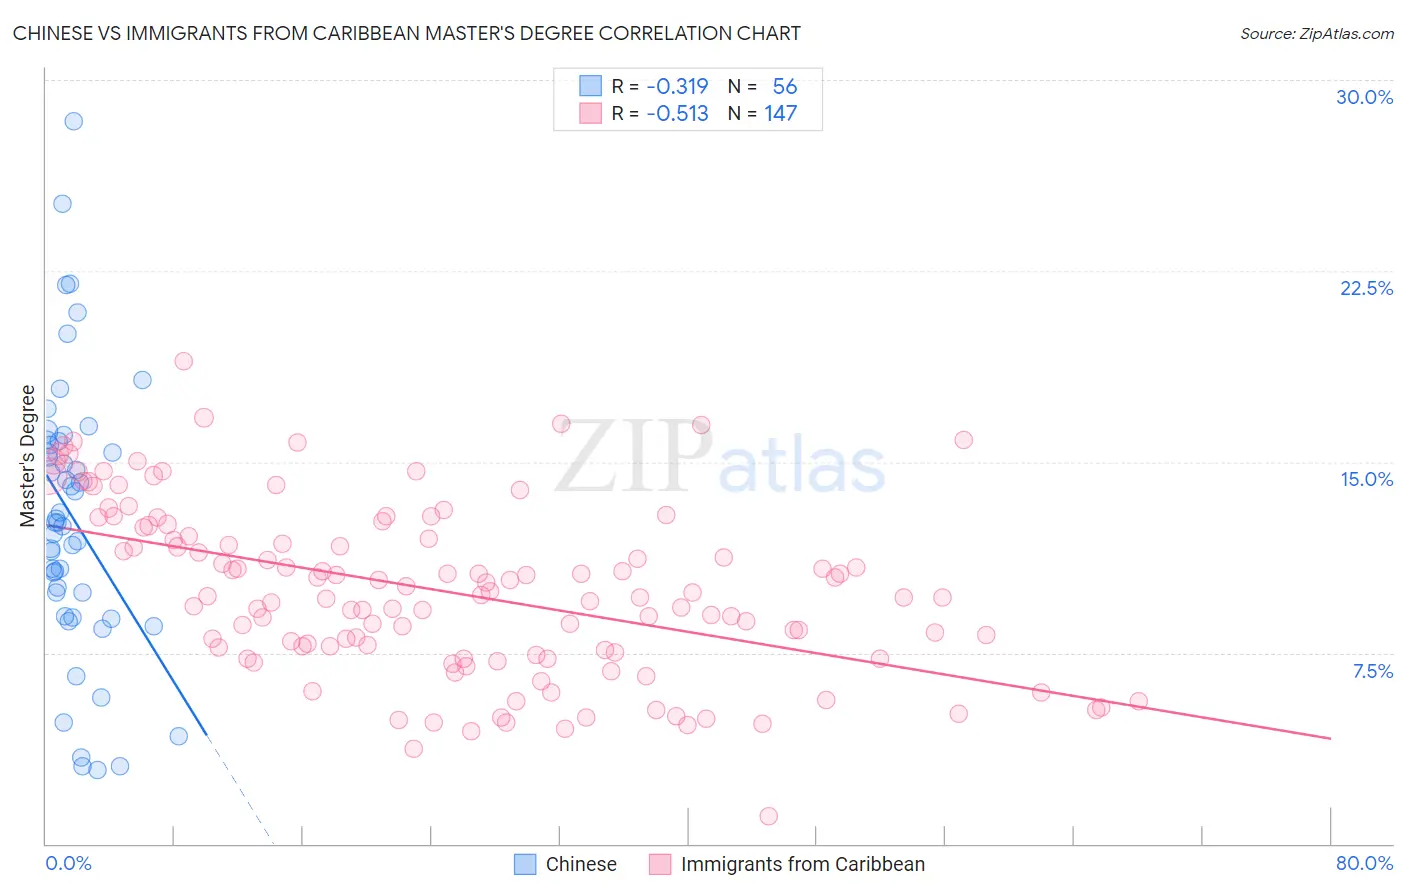
Chinese vs Immigrants from Caribbean Master's Degree Correlation Chart
The statistical analysis conducted on geographies consisting of 64,806,468 people shows a mild negative correlation between the proportion of Chinese and percentage of population with at least master's degree education in the United States with a correlation coefficient (R) of -0.319 and weighted average of 14.6%. Similarly, the statistical analysis conducted on geographies consisting of 449,853,344 people shows a substantial negative correlation between the proportion of Immigrants from Caribbean and percentage of population with at least master's degree education in the United States with a correlation coefficient (R) of -0.513 and weighted average of 12.1%, a difference of 20.7%.
Master's Degree Correlation Summary
| Measurement | Chinese | Immigrants from Caribbean |
| Minimum | 2.9% | 1.1% |
| Maximum | 28.4% | 18.9% |
| Range | 25.5% | 17.8% |
| Mean | 12.8% | 9.9% |
| Median | 12.6% | 9.7% |
| Interquartile 25% (IQ1) | 9.4% | 7.5% |
| Interquartile 75% (IQ3) | 15.7% | 12.4% |
| Interquartile Range (IQR) | 6.3% | 4.9% |
| Standard Deviation (Sample) | 5.4% | 3.3% |
| Standard Deviation (Population) | 5.3% | 3.3% |
Similar Demographics by Master's Degree
Demographics Similar to Chinese by Master's Degree
In terms of master's degree, the demographic groups most similar to Chinese are Immigrants from Nigeria (14.6%, a difference of 0.040%), Immigrants from Middle Africa (14.6%, a difference of 0.17%), Danish (14.5%, a difference of 0.18%), Welsh (14.6%, a difference of 0.26%), and Czechoslovakian (14.5%, a difference of 0.39%).
| Demographics | Rating | Rank | Master's Degree |
| Basques | 36.5 /100 | #187 | Fair 14.7% |
| Immigrants | Costa Rica | 36.2 /100 | #188 | Fair 14.7% |
| Immigrants | Immigrants | 36.0 /100 | #189 | Fair 14.6% |
| Spaniards | 35.8 /100 | #190 | Fair 14.6% |
| Welsh | 34.2 /100 | #191 | Fair 14.6% |
| Immigrants | Middle Africa | 33.6 /100 | #192 | Fair 14.6% |
| Immigrants | Nigeria | 32.7 /100 | #193 | Fair 14.6% |
| Chinese | 32.5 /100 | #194 | Fair 14.6% |
| Danes | 31.3 /100 | #195 | Fair 14.5% |
| Czechoslovakians | 29.9 /100 | #196 | Fair 14.5% |
| Belgians | 28.0 /100 | #197 | Fair 14.5% |
| West Indians | 27.4 /100 | #198 | Fair 14.5% |
| Immigrants | Armenia | 27.2 /100 | #199 | Fair 14.5% |
| Panamanians | 25.1 /100 | #200 | Fair 14.4% |
| Scotch-Irish | 25.0 /100 | #201 | Fair 14.4% |
Demographics Similar to Immigrants from Caribbean by Master's Degree
In terms of master's degree, the demographic groups most similar to Immigrants from Caribbean are Potawatomi (12.1%, a difference of 0.0%), Black/African American (12.1%, a difference of 0.010%), Cuban (12.1%, a difference of 0.060%), Cape Verdean (12.1%, a difference of 0.080%), and Immigrants from Belize (12.1%, a difference of 0.080%).
| Demographics | Rating | Rank | Master's Degree |
| Salvadorans | 0.3 /100 | #270 | Tragic 12.2% |
| Haitians | 0.3 /100 | #271 | Tragic 12.1% |
| Comanche | 0.3 /100 | #272 | Tragic 12.1% |
| Blackfeet | 0.3 /100 | #273 | Tragic 12.1% |
| Cape Verdeans | 0.3 /100 | #274 | Tragic 12.1% |
| Cubans | 0.3 /100 | #275 | Tragic 12.1% |
| Blacks/African Americans | 0.3 /100 | #276 | Tragic 12.1% |
| Immigrants | Caribbean | 0.3 /100 | #277 | Tragic 12.1% |
| Potawatomi | 0.3 /100 | #278 | Tragic 12.1% |
| Immigrants | Belize | 0.2 /100 | #279 | Tragic 12.1% |
| Immigrants | Dominican Republic | 0.2 /100 | #280 | Tragic 12.1% |
| Malaysians | 0.2 /100 | #281 | Tragic 12.0% |
| Immigrants | El Salvador | 0.2 /100 | #282 | Tragic 12.0% |
| Hondurans | 0.2 /100 | #283 | Tragic 11.9% |
| Ottawa | 0.2 /100 | #284 | Tragic 11.9% |