Menominee vs Immigrants 7th Grade
COMPARE
Menominee
Immigrants
7th Grade
7th Grade Comparison
Menominee
Immigrants
96.7%
7TH GRADE
98.7/ 100
METRIC RATING
99th/ 347
METRIC RANK
94.0%
7TH GRADE
0.0/ 100
METRIC RATING
312th/ 347
METRIC RANK
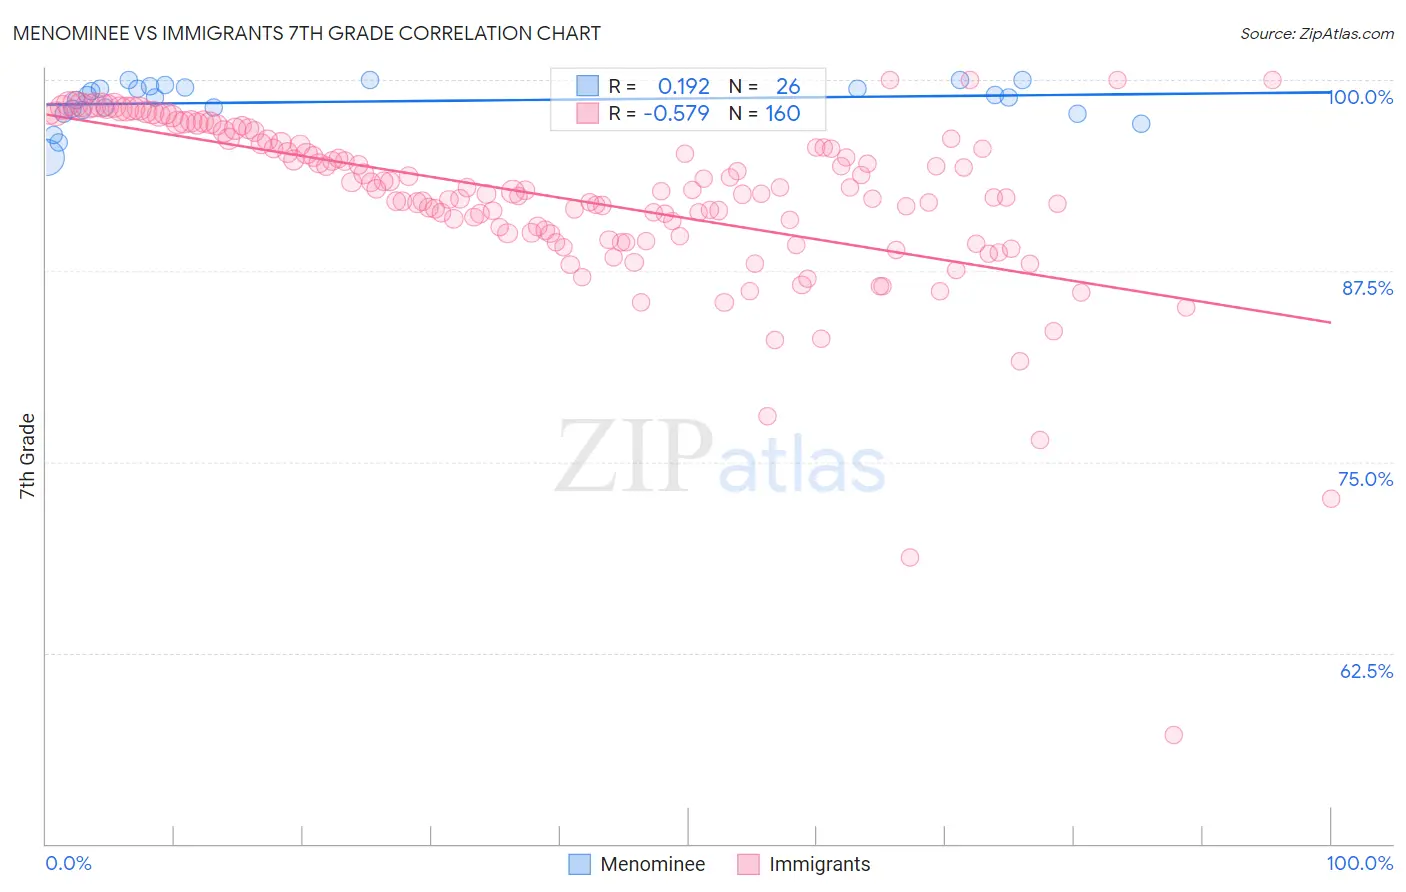
Menominee vs Immigrants 7th Grade Correlation Chart
The statistical analysis conducted on geographies consisting of 45,778,979 people shows a poor positive correlation between the proportion of Menominee and percentage of population with at least 7th grade education in the United States with a correlation coefficient (R) of 0.192 and weighted average of 96.7%. Similarly, the statistical analysis conducted on geographies consisting of 577,787,402 people shows a substantial negative correlation between the proportion of Immigrants and percentage of population with at least 7th grade education in the United States with a correlation coefficient (R) of -0.579 and weighted average of 94.0%, a difference of 2.9%.
7th Grade Correlation Summary
| Measurement | Menominee | Immigrants |
| Minimum | 94.9% | 57.2% |
| Maximum | 100.0% | 100.0% |
| Range | 5.1% | 42.8% |
| Mean | 98.6% | 92.2% |
| Median | 98.9% | 92.7% |
| Interquartile 25% (IQ1) | 98.0% | 90.0% |
| Interquartile 75% (IQ3) | 99.5% | 95.8% |
| Interquartile Range (IQR) | 1.4% | 5.9% |
| Standard Deviation (Sample) | 1.3% | 5.7% |
| Standard Deviation (Population) | 1.3% | 5.7% |
Similar Demographics by 7th Grade
Demographics Similar to Menominee by 7th Grade
In terms of 7th grade, the demographic groups most similar to Menominee are Immigrants from Denmark (96.7%, a difference of 0.0%), Immigrants from Germany (96.7%, a difference of 0.0%), Immigrants from Sweden (96.7%, a difference of 0.0%), German Russian (96.7%, a difference of 0.0%), and Thai (96.7%, a difference of 0.010%).
| Demographics | Rating | Rank | 7th Grade |
| Immigrants | Western Europe | 98.9 /100 | #92 | Exceptional 96.7% |
| Potawatomi | 98.9 /100 | #93 | Exceptional 96.7% |
| Lebanese | 98.8 /100 | #94 | Exceptional 96.7% |
| Immigrants | Australia | 98.8 /100 | #95 | Exceptional 96.7% |
| Immigrants | Denmark | 98.7 /100 | #96 | Exceptional 96.7% |
| Immigrants | Germany | 98.7 /100 | #97 | Exceptional 96.7% |
| Immigrants | Sweden | 98.7 /100 | #98 | Exceptional 96.7% |
| Menominee | 98.7 /100 | #99 | Exceptional 96.7% |
| German Russians | 98.6 /100 | #100 | Exceptional 96.7% |
| Thais | 98.6 /100 | #101 | Exceptional 96.7% |
| Immigrants | Czechoslovakia | 98.3 /100 | #102 | Exceptional 96.6% |
| Immigrants | Singapore | 98.3 /100 | #103 | Exceptional 96.6% |
| Shoshone | 98.1 /100 | #104 | Exceptional 96.6% |
| South Africans | 98.0 /100 | #105 | Exceptional 96.6% |
| Iroquois | 97.9 /100 | #106 | Exceptional 96.6% |
Demographics Similar to Immigrants by 7th Grade
In terms of 7th grade, the demographic groups most similar to Immigrants are Immigrants from Bangladesh (94.0%, a difference of 0.0%), Japanese (94.0%, a difference of 0.030%), Puerto Rican (94.0%, a difference of 0.040%), Immigrants from Caribbean (94.0%, a difference of 0.050%), and Ecuadorian (94.0%, a difference of 0.060%).
| Demographics | Rating | Rank | 7th Grade |
| Guyanese | 0.0 /100 | #305 | Tragic 94.3% |
| Immigrants | Guyana | 0.0 /100 | #306 | Tragic 94.2% |
| Immigrants | Portugal | 0.0 /100 | #307 | Tragic 94.2% |
| Cape Verdeans | 0.0 /100 | #308 | Tragic 94.1% |
| Ecuadorians | 0.0 /100 | #309 | Tragic 94.0% |
| Immigrants | Caribbean | 0.0 /100 | #310 | Tragic 94.0% |
| Puerto Ricans | 0.0 /100 | #311 | Tragic 94.0% |
| Immigrants | Immigrants | 0.0 /100 | #312 | Tragic 94.0% |
| Immigrants | Bangladesh | 0.0 /100 | #313 | Tragic 94.0% |
| Japanese | 0.0 /100 | #314 | Tragic 94.0% |
| Vietnamese | 0.0 /100 | #315 | Tragic 93.9% |
| Immigrants | Vietnam | 0.0 /100 | #316 | Tragic 93.9% |
| Immigrants | Cuba | 0.0 /100 | #317 | Tragic 93.8% |
| Immigrants | Ecuador | 0.0 /100 | #318 | Tragic 93.7% |
| Immigrants | Cambodia | 0.0 /100 | #319 | Tragic 93.7% |