Menominee vs Ethiopian 7th Grade
COMPARE
Menominee
Ethiopian
7th Grade
7th Grade Comparison
Menominee
Ethiopians
96.7%
7TH GRADE
98.7/ 100
METRIC RATING
99th/ 347
METRIC RANK
95.4%
7TH GRADE
1.5/ 100
METRIC RATING
246th/ 347
METRIC RANK
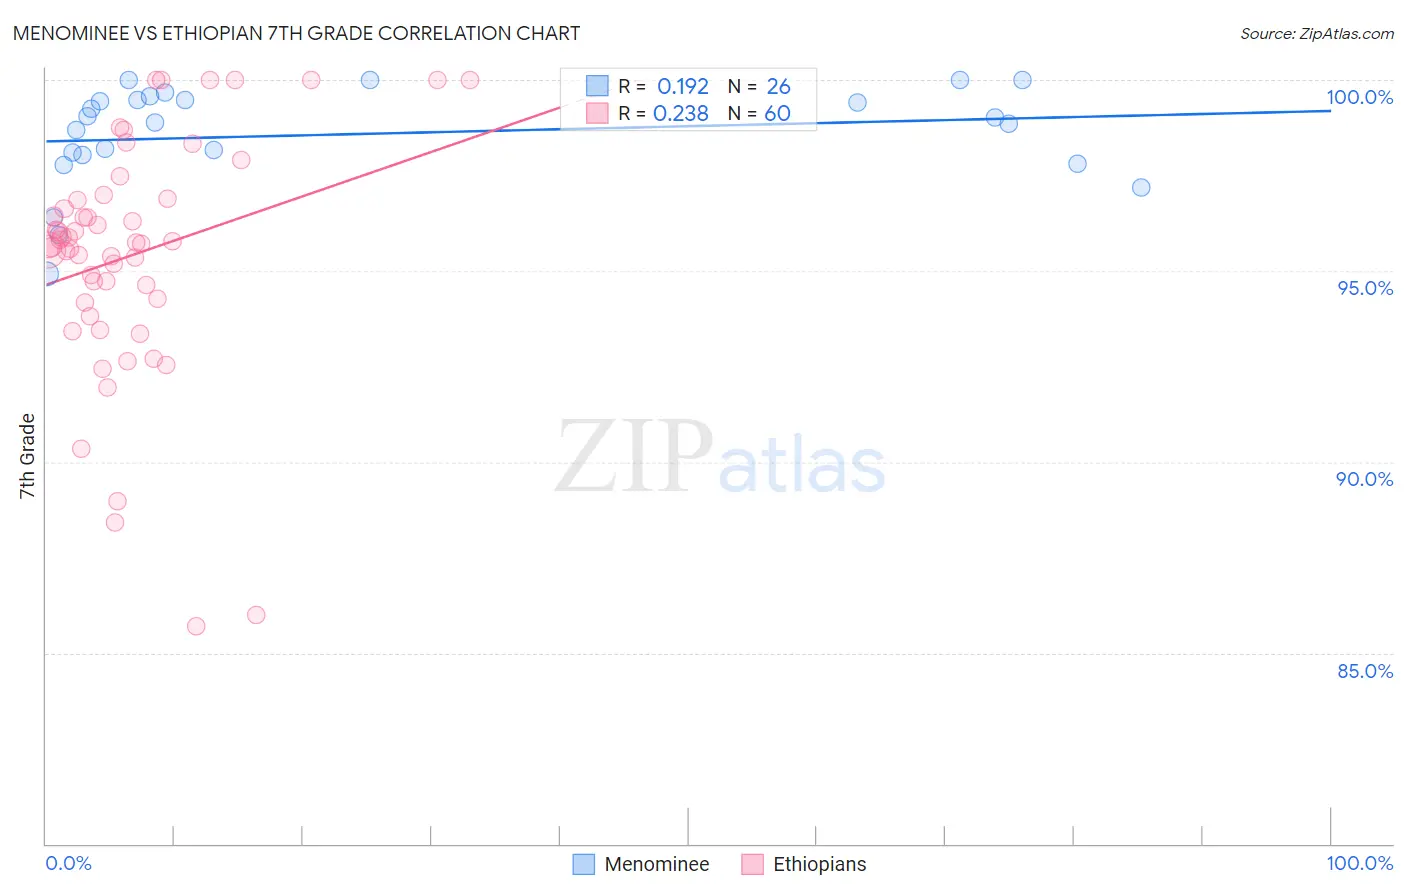
Menominee vs Ethiopian 7th Grade Correlation Chart
The statistical analysis conducted on geographies consisting of 45,778,979 people shows a poor positive correlation between the proportion of Menominee and percentage of population with at least 7th grade education in the United States with a correlation coefficient (R) of 0.192 and weighted average of 96.7%. Similarly, the statistical analysis conducted on geographies consisting of 223,161,778 people shows a weak positive correlation between the proportion of Ethiopians and percentage of population with at least 7th grade education in the United States with a correlation coefficient (R) of 0.238 and weighted average of 95.4%, a difference of 1.3%.
7th Grade Correlation Summary
| Measurement | Menominee | Ethiopian |
| Minimum | 94.9% | 85.7% |
| Maximum | 100.0% | 100.0% |
| Range | 5.1% | 14.3% |
| Mean | 98.6% | 95.4% |
| Median | 98.9% | 95.7% |
| Interquartile 25% (IQ1) | 98.0% | 94.2% |
| Interquartile 75% (IQ3) | 99.5% | 96.9% |
| Interquartile Range (IQR) | 1.4% | 2.7% |
| Standard Deviation (Sample) | 1.3% | 3.1% |
| Standard Deviation (Population) | 1.3% | 3.1% |
Similar Demographics by 7th Grade
Demographics Similar to Menominee by 7th Grade
In terms of 7th grade, the demographic groups most similar to Menominee are Immigrants from Denmark (96.7%, a difference of 0.0%), Immigrants from Germany (96.7%, a difference of 0.0%), Immigrants from Sweden (96.7%, a difference of 0.0%), German Russian (96.7%, a difference of 0.0%), and Thai (96.7%, a difference of 0.010%).
| Demographics | Rating | Rank | 7th Grade |
| Immigrants | Western Europe | 98.9 /100 | #92 | Exceptional 96.7% |
| Potawatomi | 98.9 /100 | #93 | Exceptional 96.7% |
| Lebanese | 98.8 /100 | #94 | Exceptional 96.7% |
| Immigrants | Australia | 98.8 /100 | #95 | Exceptional 96.7% |
| Immigrants | Denmark | 98.7 /100 | #96 | Exceptional 96.7% |
| Immigrants | Germany | 98.7 /100 | #97 | Exceptional 96.7% |
| Immigrants | Sweden | 98.7 /100 | #98 | Exceptional 96.7% |
| Menominee | 98.7 /100 | #99 | Exceptional 96.7% |
| German Russians | 98.6 /100 | #100 | Exceptional 96.7% |
| Thais | 98.6 /100 | #101 | Exceptional 96.7% |
| Immigrants | Czechoslovakia | 98.3 /100 | #102 | Exceptional 96.6% |
| Immigrants | Singapore | 98.3 /100 | #103 | Exceptional 96.6% |
| Shoshone | 98.1 /100 | #104 | Exceptional 96.6% |
| South Africans | 98.0 /100 | #105 | Exceptional 96.6% |
| Iroquois | 97.9 /100 | #106 | Exceptional 96.6% |
Demographics Similar to Ethiopians by 7th Grade
In terms of 7th grade, the demographic groups most similar to Ethiopians are Uruguayan (95.4%, a difference of 0.010%), Immigrants from Middle Africa (95.4%, a difference of 0.010%), U.S. Virgin Islander (95.4%, a difference of 0.020%), Tongan (95.4%, a difference of 0.020%), and Immigrants from Senegal (95.5%, a difference of 0.040%).
| Demographics | Rating | Rank | 7th Grade |
| Jamaicans | 2.2 /100 | #239 | Tragic 95.5% |
| Immigrants | Sierra Leone | 2.0 /100 | #240 | Tragic 95.5% |
| South American Indians | 2.0 /100 | #241 | Tragic 95.5% |
| Immigrants | Senegal | 1.9 /100 | #242 | Tragic 95.5% |
| U.S. Virgin Islanders | 1.6 /100 | #243 | Tragic 95.4% |
| Uruguayans | 1.6 /100 | #244 | Tragic 95.4% |
| Immigrants | Middle Africa | 1.5 /100 | #245 | Tragic 95.4% |
| Ethiopians | 1.5 /100 | #246 | Tragic 95.4% |
| Tongans | 1.3 /100 | #247 | Tragic 95.4% |
| Paiute | 1.2 /100 | #248 | Tragic 95.4% |
| Bolivians | 1.1 /100 | #249 | Tragic 95.4% |
| Immigrants | Cameroon | 0.9 /100 | #250 | Tragic 95.4% |
| Immigrants | Jamaica | 0.9 /100 | #251 | Tragic 95.4% |
| Immigrants | Ethiopia | 0.9 /100 | #252 | Tragic 95.3% |
| Somalis | 0.9 /100 | #253 | Tragic 95.3% |