Menominee vs Immigrants from Iraq 7th Grade
COMPARE
Menominee
Immigrants from Iraq
7th Grade
7th Grade Comparison
Menominee
Immigrants from Iraq
96.7%
7TH GRADE
98.7/ 100
METRIC RATING
99th/ 347
METRIC RANK
96.0%
7TH GRADE
36.1/ 100
METRIC RATING
186th/ 347
METRIC RANK
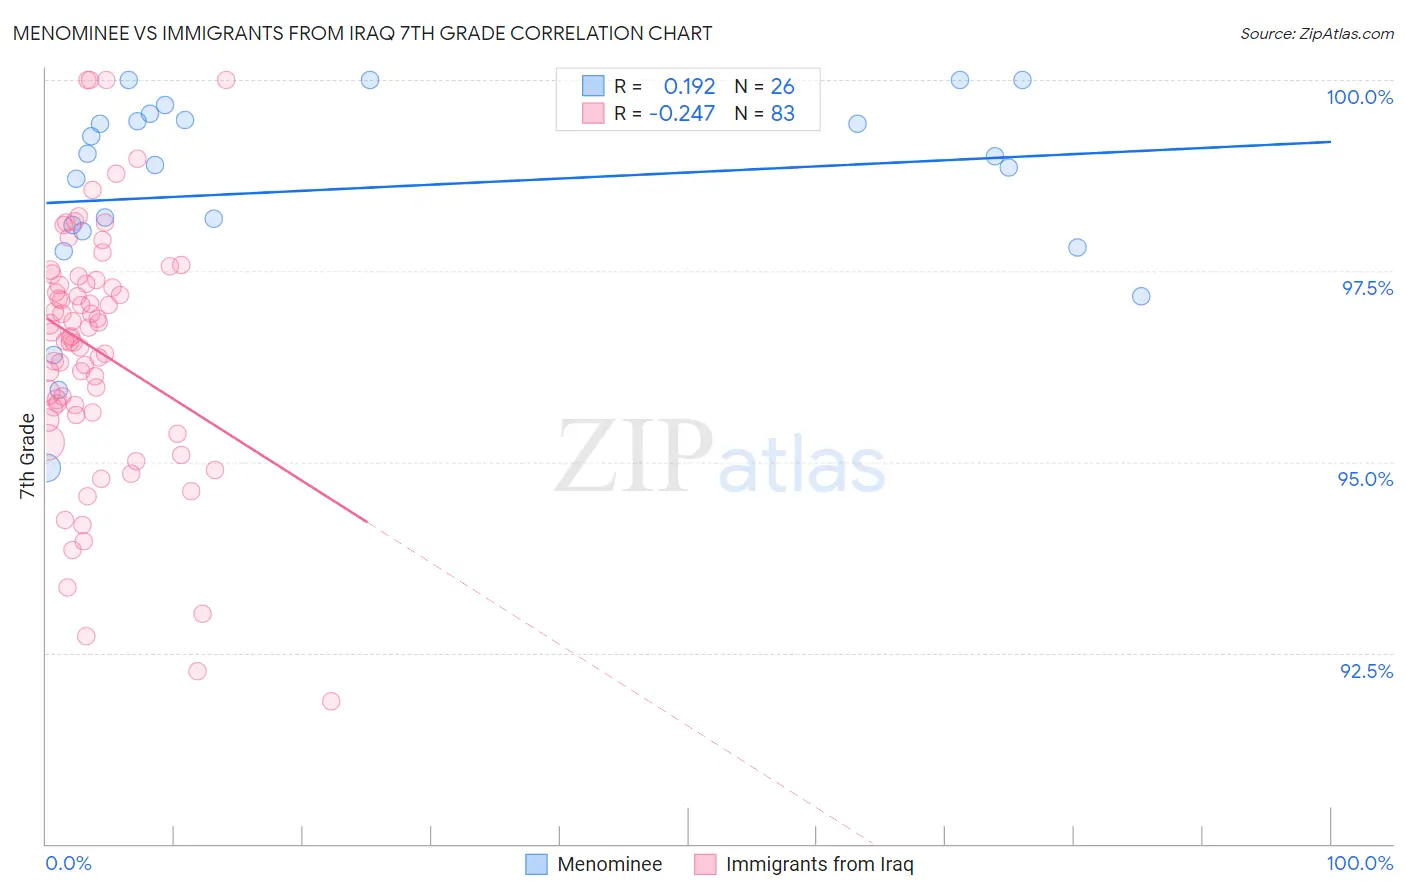
Menominee vs Immigrants from Iraq 7th Grade Correlation Chart
The statistical analysis conducted on geographies consisting of 45,778,979 people shows a poor positive correlation between the proportion of Menominee and percentage of population with at least 7th grade education in the United States with a correlation coefficient (R) of 0.192 and weighted average of 96.7%. Similarly, the statistical analysis conducted on geographies consisting of 194,632,332 people shows a weak negative correlation between the proportion of Immigrants from Iraq and percentage of population with at least 7th grade education in the United States with a correlation coefficient (R) of -0.247 and weighted average of 96.0%, a difference of 0.75%.
7th Grade Correlation Summary
| Measurement | Menominee | Immigrants from Iraq |
| Minimum | 94.9% | 91.9% |
| Maximum | 100.0% | 100.0% |
| Range | 5.1% | 8.1% |
| Mean | 98.6% | 96.5% |
| Median | 98.9% | 96.6% |
| Interquartile 25% (IQ1) | 98.0% | 95.7% |
| Interquartile 75% (IQ3) | 99.5% | 97.4% |
| Interquartile Range (IQR) | 1.4% | 1.7% |
| Standard Deviation (Sample) | 1.3% | 1.7% |
| Standard Deviation (Population) | 1.3% | 1.6% |
Similar Demographics by 7th Grade
Demographics Similar to Menominee by 7th Grade
In terms of 7th grade, the demographic groups most similar to Menominee are Immigrants from Denmark (96.7%, a difference of 0.0%), Immigrants from Germany (96.7%, a difference of 0.0%), Immigrants from Sweden (96.7%, a difference of 0.0%), German Russian (96.7%, a difference of 0.0%), and Thai (96.7%, a difference of 0.010%).
| Demographics | Rating | Rank | 7th Grade |
| Immigrants | Western Europe | 98.9 /100 | #92 | Exceptional 96.7% |
| Potawatomi | 98.9 /100 | #93 | Exceptional 96.7% |
| Lebanese | 98.8 /100 | #94 | Exceptional 96.7% |
| Immigrants | Australia | 98.8 /100 | #95 | Exceptional 96.7% |
| Immigrants | Denmark | 98.7 /100 | #96 | Exceptional 96.7% |
| Immigrants | Germany | 98.7 /100 | #97 | Exceptional 96.7% |
| Immigrants | Sweden | 98.7 /100 | #98 | Exceptional 96.7% |
| Menominee | 98.7 /100 | #99 | Exceptional 96.7% |
| German Russians | 98.6 /100 | #100 | Exceptional 96.7% |
| Thais | 98.6 /100 | #101 | Exceptional 96.7% |
| Immigrants | Czechoslovakia | 98.3 /100 | #102 | Exceptional 96.6% |
| Immigrants | Singapore | 98.3 /100 | #103 | Exceptional 96.6% |
| Shoshone | 98.1 /100 | #104 | Exceptional 96.6% |
| South Africans | 98.0 /100 | #105 | Exceptional 96.6% |
| Iroquois | 97.9 /100 | #106 | Exceptional 96.6% |
Demographics Similar to Immigrants from Iraq by 7th Grade
In terms of 7th grade, the demographic groups most similar to Immigrants from Iraq are Immigrants from Uganda (96.0%, a difference of 0.0%), Sierra Leonean (96.0%, a difference of 0.010%), Brazilian (96.0%, a difference of 0.010%), Immigrants from Egypt (95.9%, a difference of 0.010%), and Immigrants from Venezuela (95.9%, a difference of 0.010%).
| Demographics | Rating | Rank | 7th Grade |
| Immigrants | Iran | 47.8 /100 | #179 | Average 96.0% |
| Immigrants | Brazil | 46.8 /100 | #180 | Average 96.0% |
| Pakistanis | 44.5 /100 | #181 | Average 96.0% |
| Iraqis | 41.2 /100 | #182 | Average 96.0% |
| Immigrants | Spain | 38.8 /100 | #183 | Fair 96.0% |
| Sierra Leoneans | 37.5 /100 | #184 | Fair 96.0% |
| Brazilians | 37.3 /100 | #185 | Fair 96.0% |
| Immigrants | Iraq | 36.1 /100 | #186 | Fair 96.0% |
| Immigrants | Uganda | 36.0 /100 | #187 | Fair 96.0% |
| Immigrants | Egypt | 34.3 /100 | #188 | Fair 95.9% |
| Immigrants | Venezuela | 33.9 /100 | #189 | Fair 95.9% |
| Immigrants | Micronesia | 32.6 /100 | #190 | Fair 95.9% |
| Liberians | 32.5 /100 | #191 | Fair 95.9% |
| Panamanians | 32.3 /100 | #192 | Fair 95.9% |
| Immigrants | Bahamas | 30.8 /100 | #193 | Fair 95.9% |