Moroccan vs Immigrants 7th Grade
COMPARE
Moroccan
Immigrants
7th Grade
7th Grade Comparison
Moroccans
Immigrants
95.8%
7TH GRADE
18.9/ 100
METRIC RATING
205th/ 347
METRIC RANK
94.0%
7TH GRADE
0.0/ 100
METRIC RATING
312th/ 347
METRIC RANK
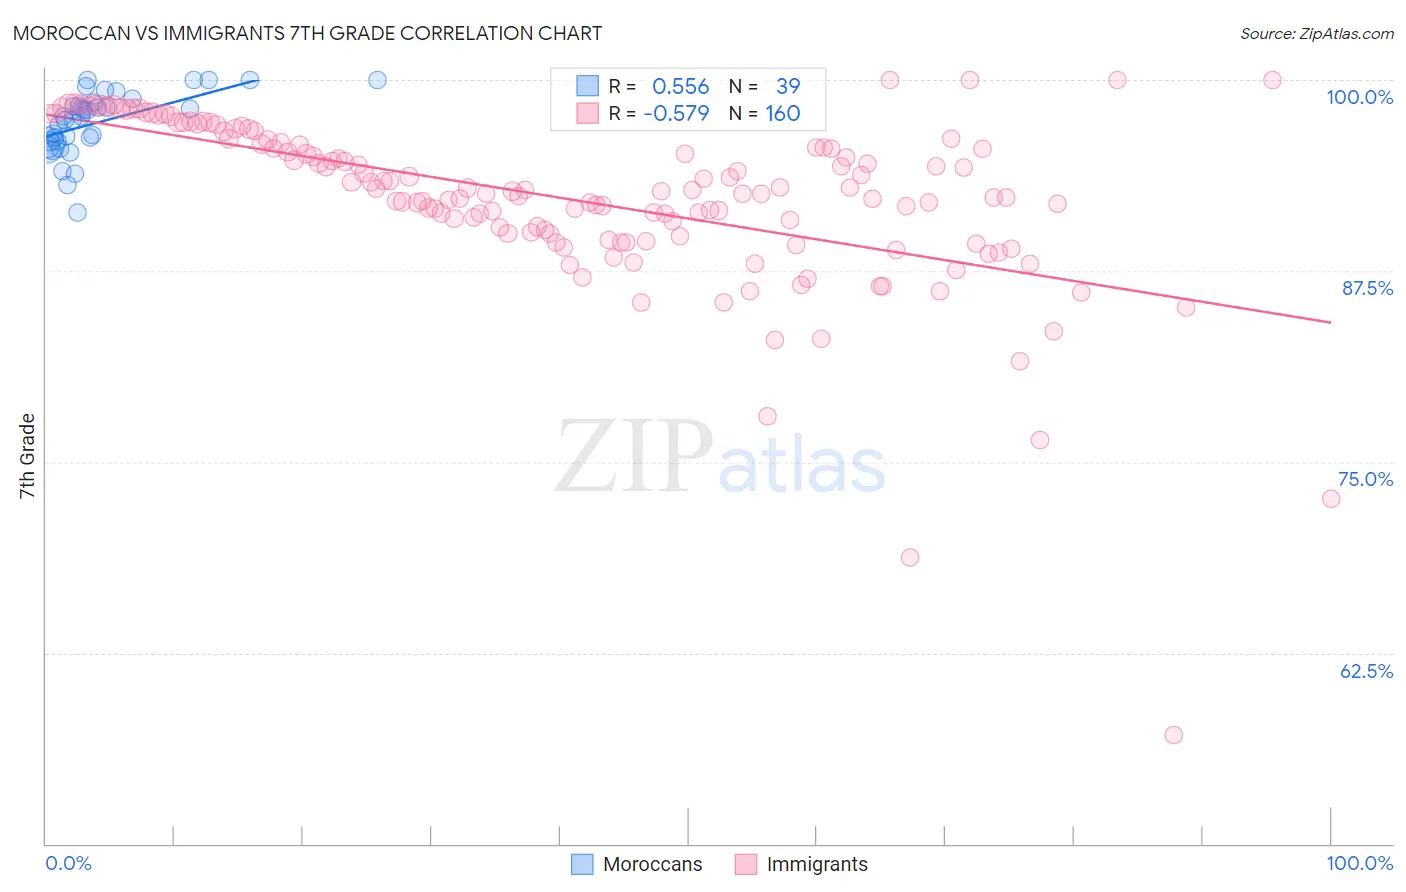
Moroccan vs Immigrants 7th Grade Correlation Chart
The statistical analysis conducted on geographies consisting of 201,817,667 people shows a substantial positive correlation between the proportion of Moroccans and percentage of population with at least 7th grade education in the United States with a correlation coefficient (R) of 0.556 and weighted average of 95.8%. Similarly, the statistical analysis conducted on geographies consisting of 577,787,402 people shows a substantial negative correlation between the proportion of Immigrants and percentage of population with at least 7th grade education in the United States with a correlation coefficient (R) of -0.579 and weighted average of 94.0%, a difference of 1.9%.
7th Grade Correlation Summary
| Measurement | Moroccan | Immigrants |
| Minimum | 91.3% | 57.2% |
| Maximum | 100.0% | 100.0% |
| Range | 8.7% | 42.8% |
| Mean | 97.2% | 92.2% |
| Median | 97.6% | 92.7% |
| Interquartile 25% (IQ1) | 96.0% | 90.0% |
| Interquartile 75% (IQ3) | 98.5% | 95.8% |
| Interquartile Range (IQR) | 2.5% | 5.9% |
| Standard Deviation (Sample) | 2.0% | 5.7% |
| Standard Deviation (Population) | 2.0% | 5.7% |
Similar Demographics by 7th Grade
Demographics Similar to Moroccans by 7th Grade
In terms of 7th grade, the demographic groups most similar to Moroccans are African (95.8%, a difference of 0.010%), Immigrants from Northern Africa (95.8%, a difference of 0.020%), Comanche (95.8%, a difference of 0.020%), Assyrian/Chaldean/Syriac (95.8%, a difference of 0.020%), and Navajo (95.8%, a difference of 0.020%).
| Demographics | Rating | Rank | 7th Grade |
| Paraguayans | 24.8 /100 | #198 | Fair 95.9% |
| Guamanians/Chamorros | 23.5 /100 | #199 | Fair 95.9% |
| Argentineans | 23.2 /100 | #200 | Fair 95.9% |
| Immigrants | Argentina | 21.9 /100 | #201 | Fair 95.9% |
| Immigrants | Northern Africa | 21.4 /100 | #202 | Fair 95.8% |
| Comanche | 21.1 /100 | #203 | Fair 95.8% |
| Assyrians/Chaldeans/Syriacs | 20.5 /100 | #204 | Fair 95.8% |
| Moroccans | 18.9 /100 | #205 | Poor 95.8% |
| Africans | 17.6 /100 | #206 | Poor 95.8% |
| Navajo | 17.0 /100 | #207 | Poor 95.8% |
| Immigrants | Sudan | 17.0 /100 | #208 | Poor 95.8% |
| Dutch West Indians | 16.1 /100 | #209 | Poor 95.8% |
| Hawaiians | 16.0 /100 | #210 | Poor 95.8% |
| Portuguese | 13.6 /100 | #211 | Poor 95.8% |
| Immigrants | Lebanon | 13.0 /100 | #212 | Poor 95.8% |
Demographics Similar to Immigrants by 7th Grade
In terms of 7th grade, the demographic groups most similar to Immigrants are Immigrants from Bangladesh (94.0%, a difference of 0.0%), Japanese (94.0%, a difference of 0.030%), Puerto Rican (94.0%, a difference of 0.040%), Immigrants from Caribbean (94.0%, a difference of 0.050%), and Ecuadorian (94.0%, a difference of 0.060%).
| Demographics | Rating | Rank | 7th Grade |
| Guyanese | 0.0 /100 | #305 | Tragic 94.3% |
| Immigrants | Guyana | 0.0 /100 | #306 | Tragic 94.2% |
| Immigrants | Portugal | 0.0 /100 | #307 | Tragic 94.2% |
| Cape Verdeans | 0.0 /100 | #308 | Tragic 94.1% |
| Ecuadorians | 0.0 /100 | #309 | Tragic 94.0% |
| Immigrants | Caribbean | 0.0 /100 | #310 | Tragic 94.0% |
| Puerto Ricans | 0.0 /100 | #311 | Tragic 94.0% |
| Immigrants | Immigrants | 0.0 /100 | #312 | Tragic 94.0% |
| Immigrants | Bangladesh | 0.0 /100 | #313 | Tragic 94.0% |
| Japanese | 0.0 /100 | #314 | Tragic 94.0% |
| Vietnamese | 0.0 /100 | #315 | Tragic 93.9% |
| Immigrants | Vietnam | 0.0 /100 | #316 | Tragic 93.9% |
| Immigrants | Cuba | 0.0 /100 | #317 | Tragic 93.8% |
| Immigrants | Ecuador | 0.0 /100 | #318 | Tragic 93.7% |
| Immigrants | Cambodia | 0.0 /100 | #319 | Tragic 93.7% |