Immigrants from Chile vs Immigrants 7th Grade
COMPARE
Immigrants from Chile
Immigrants
7th Grade
7th Grade Comparison
Immigrants from Chile
Immigrants
95.7%
7TH GRADE
9.1/ 100
METRIC RATING
216th/ 347
METRIC RANK
94.0%
7TH GRADE
0.0/ 100
METRIC RATING
312th/ 347
METRIC RANK
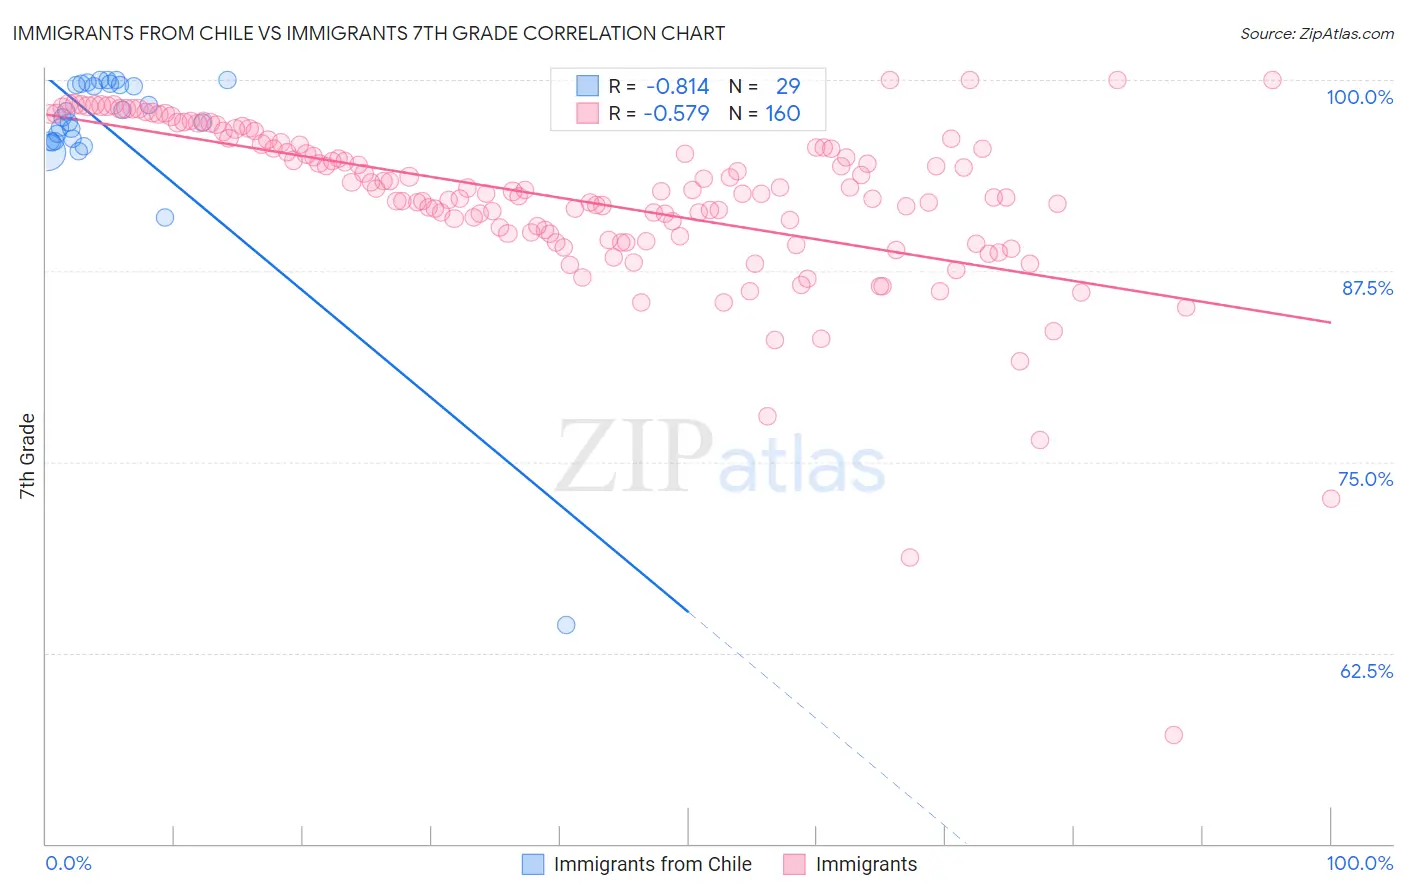
Immigrants from Chile vs Immigrants 7th Grade Correlation Chart
The statistical analysis conducted on geographies consisting of 218,647,266 people shows a very strong negative correlation between the proportion of Immigrants from Chile and percentage of population with at least 7th grade education in the United States with a correlation coefficient (R) of -0.814 and weighted average of 95.7%. Similarly, the statistical analysis conducted on geographies consisting of 577,787,402 people shows a substantial negative correlation between the proportion of Immigrants and percentage of population with at least 7th grade education in the United States with a correlation coefficient (R) of -0.579 and weighted average of 94.0%, a difference of 1.8%.
7th Grade Correlation Summary
| Measurement | Immigrants from Chile | Immigrants |
| Minimum | 64.3% | 57.2% |
| Maximum | 100.0% | 100.0% |
| Range | 35.7% | 42.8% |
| Mean | 96.6% | 92.2% |
| Median | 97.6% | 92.7% |
| Interquartile 25% (IQ1) | 96.0% | 90.0% |
| Interquartile 75% (IQ3) | 99.7% | 95.8% |
| Interquartile Range (IQR) | 3.7% | 5.9% |
| Standard Deviation (Sample) | 6.6% | 5.7% |
| Standard Deviation (Population) | 6.4% | 5.7% |
Similar Demographics by 7th Grade
Demographics Similar to Immigrants from Chile by 7th Grade
In terms of 7th grade, the demographic groups most similar to Immigrants from Chile are Spanish American (95.7%, a difference of 0.0%), Immigrants from Pakistan (95.7%, a difference of 0.0%), Immigrants from Liberia (95.7%, a difference of 0.020%), Immigrants from Southern Europe (95.7%, a difference of 0.020%), and Bahamian (95.7%, a difference of 0.040%).
| Demographics | Rating | Rank | 7th Grade |
| Dutch West Indians | 16.1 /100 | #209 | Poor 95.8% |
| Hawaiians | 16.0 /100 | #210 | Poor 95.8% |
| Portuguese | 13.6 /100 | #211 | Poor 95.8% |
| Immigrants | Lebanon | 13.0 /100 | #212 | Poor 95.8% |
| Immigrants | Morocco | 12.6 /100 | #213 | Poor 95.8% |
| Bahamians | 11.6 /100 | #214 | Poor 95.7% |
| Spanish Americans | 9.3 /100 | #215 | Tragic 95.7% |
| Immigrants | Chile | 9.1 /100 | #216 | Tragic 95.7% |
| Immigrants | Pakistan | 9.0 /100 | #217 | Tragic 95.7% |
| Immigrants | Liberia | 8.1 /100 | #218 | Tragic 95.7% |
| Immigrants | Southern Europe | 7.9 /100 | #219 | Tragic 95.7% |
| Sub-Saharan Africans | 7.2 /100 | #220 | Tragic 95.7% |
| Samoans | 7.0 /100 | #221 | Tragic 95.7% |
| Laotians | 6.8 /100 | #222 | Tragic 95.7% |
| Immigrants | Syria | 6.7 /100 | #223 | Tragic 95.7% |
Demographics Similar to Immigrants by 7th Grade
In terms of 7th grade, the demographic groups most similar to Immigrants are Immigrants from Bangladesh (94.0%, a difference of 0.0%), Japanese (94.0%, a difference of 0.030%), Puerto Rican (94.0%, a difference of 0.040%), Immigrants from Caribbean (94.0%, a difference of 0.050%), and Ecuadorian (94.0%, a difference of 0.060%).
| Demographics | Rating | Rank | 7th Grade |
| Guyanese | 0.0 /100 | #305 | Tragic 94.3% |
| Immigrants | Guyana | 0.0 /100 | #306 | Tragic 94.2% |
| Immigrants | Portugal | 0.0 /100 | #307 | Tragic 94.2% |
| Cape Verdeans | 0.0 /100 | #308 | Tragic 94.1% |
| Ecuadorians | 0.0 /100 | #309 | Tragic 94.0% |
| Immigrants | Caribbean | 0.0 /100 | #310 | Tragic 94.0% |
| Puerto Ricans | 0.0 /100 | #311 | Tragic 94.0% |
| Immigrants | Immigrants | 0.0 /100 | #312 | Tragic 94.0% |
| Immigrants | Bangladesh | 0.0 /100 | #313 | Tragic 94.0% |
| Japanese | 0.0 /100 | #314 | Tragic 94.0% |
| Vietnamese | 0.0 /100 | #315 | Tragic 93.9% |
| Immigrants | Vietnam | 0.0 /100 | #316 | Tragic 93.9% |
| Immigrants | Cuba | 0.0 /100 | #317 | Tragic 93.8% |
| Immigrants | Ecuador | 0.0 /100 | #318 | Tragic 93.7% |
| Immigrants | Cambodia | 0.0 /100 | #319 | Tragic 93.7% |