Marshallese vs South American Indian In Labor Force | Age 25-29
COMPARE
Marshallese
South American Indian
In Labor Force | Age 25-29
In Labor Force | Age 25-29 Comparison
Marshallese
South American Indians
83.3%
IN LABOR FORCE | AGE 25-29
0.0/ 100
METRIC RATING
274th/ 347
METRIC RANK
84.5%
IN LABOR FORCE | AGE 25-29
25.0/ 100
METRIC RATING
193rd/ 347
METRIC RANK
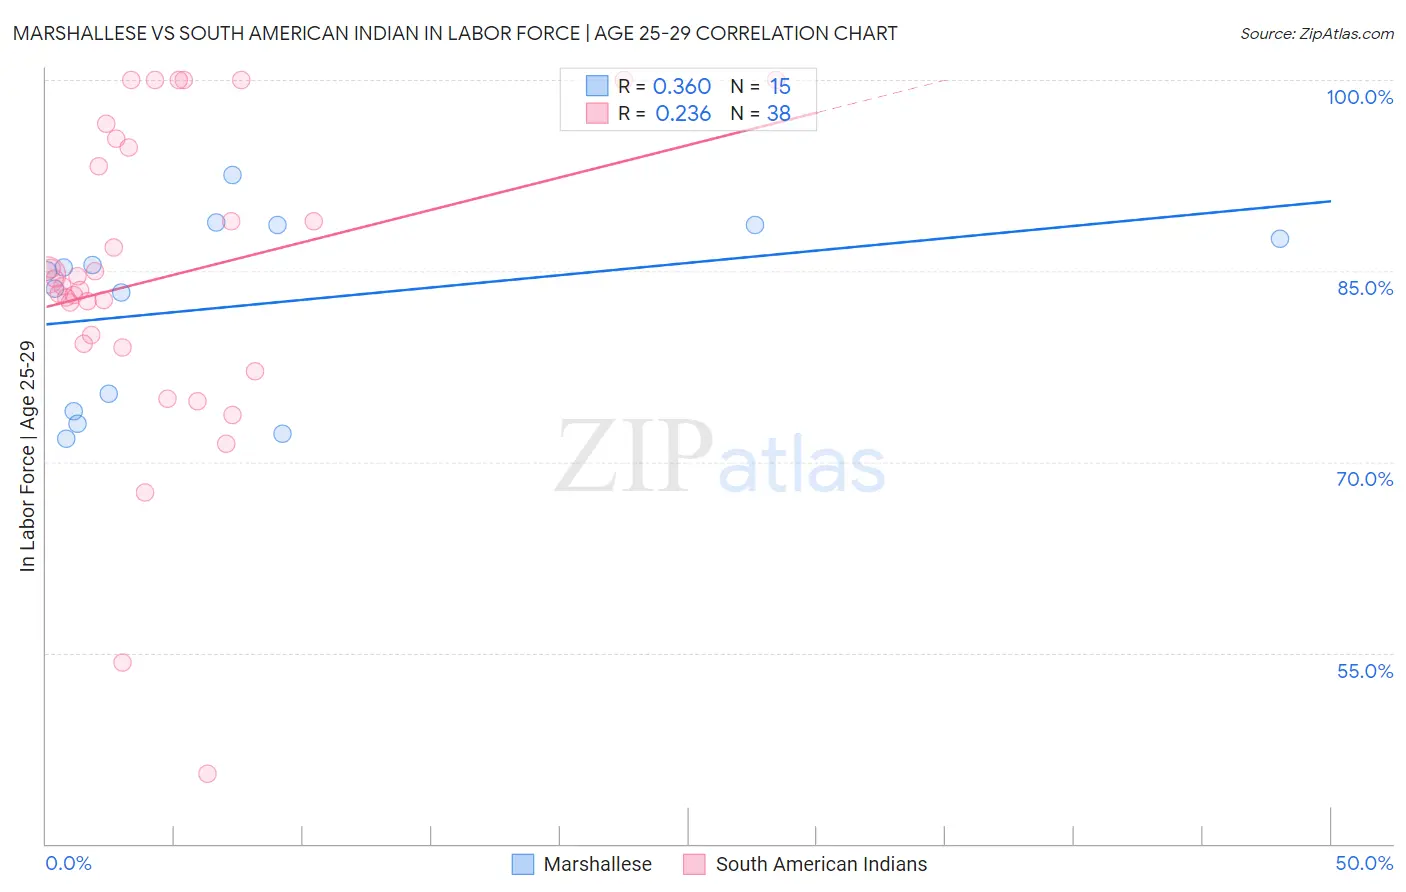
Marshallese vs South American Indian In Labor Force | Age 25-29 Correlation Chart
The statistical analysis conducted on geographies consisting of 14,760,991 people shows a mild positive correlation between the proportion of Marshallese and labor force participation rate among population between the ages 25 and 29 in the United States with a correlation coefficient (R) of 0.360 and weighted average of 83.3%. Similarly, the statistical analysis conducted on geographies consisting of 164,547,486 people shows a weak positive correlation between the proportion of South American Indians and labor force participation rate among population between the ages 25 and 29 in the United States with a correlation coefficient (R) of 0.236 and weighted average of 84.5%, a difference of 1.4%.
In Labor Force | Age 25-29 Correlation Summary
| Measurement | Marshallese | South American Indian |
| Minimum | 71.9% | 45.5% |
| Maximum | 92.5% | 100.0% |
| Range | 20.6% | 54.5% |
| Mean | 82.3% | 84.5% |
| Median | 85.0% | 84.1% |
| Interquartile 25% (IQ1) | 74.0% | 79.3% |
| Interquartile 75% (IQ3) | 88.6% | 94.7% |
| Interquartile Range (IQR) | 14.6% | 15.4% |
| Standard Deviation (Sample) | 7.0% | 12.2% |
| Standard Deviation (Population) | 6.8% | 12.0% |
Similar Demographics by In Labor Force | Age 25-29
Demographics Similar to Marshallese by In Labor Force | Age 25-29
In terms of in labor force | age 25-29, the demographic groups most similar to Marshallese are Immigrants from Caribbean (83.4%, a difference of 0.030%), Immigrants from Dominica (83.4%, a difference of 0.030%), Samoan (83.3%, a difference of 0.050%), Immigrants from Honduras (83.3%, a difference of 0.050%), and Honduran (83.4%, a difference of 0.060%).
| Demographics | Rating | Rank | In Labor Force | Age 25-29 |
| Spanish Americans | 0.0 /100 | #267 | Tragic 83.4% |
| Immigrants | Lebanon | 0.0 /100 | #268 | Tragic 83.4% |
| Immigrants | Barbados | 0.0 /100 | #269 | Tragic 83.4% |
| Basques | 0.0 /100 | #270 | Tragic 83.4% |
| Hondurans | 0.0 /100 | #271 | Tragic 83.4% |
| Immigrants | Caribbean | 0.0 /100 | #272 | Tragic 83.4% |
| Immigrants | Dominica | 0.0 /100 | #273 | Tragic 83.4% |
| Marshallese | 0.0 /100 | #274 | Tragic 83.3% |
| Samoans | 0.0 /100 | #275 | Tragic 83.3% |
| Immigrants | Honduras | 0.0 /100 | #276 | Tragic 83.3% |
| Africans | 0.0 /100 | #277 | Tragic 83.2% |
| Immigrants | Cuba | 0.0 /100 | #278 | Tragic 83.2% |
| British West Indians | 0.0 /100 | #279 | Tragic 83.2% |
| Dominicans | 0.0 /100 | #280 | Tragic 83.2% |
| Immigrants | Dominican Republic | 0.0 /100 | #281 | Tragic 83.1% |
Demographics Similar to South American Indians by In Labor Force | Age 25-29
In terms of in labor force | age 25-29, the demographic groups most similar to South American Indians are English (84.5%, a difference of 0.010%), Zimbabwean (84.5%, a difference of 0.030%), Portuguese (84.4%, a difference of 0.040%), Immigrants from Israel (84.4%, a difference of 0.040%), and Welsh (84.5%, a difference of 0.060%).
| Demographics | Rating | Rank | In Labor Force | Age 25-29 |
| Immigrants | Belgium | 35.0 /100 | #186 | Fair 84.6% |
| Immigrants | Portugal | 34.7 /100 | #187 | Fair 84.6% |
| Immigrants | Ukraine | 33.7 /100 | #188 | Fair 84.5% |
| Moroccans | 32.6 /100 | #189 | Fair 84.5% |
| Welsh | 31.1 /100 | #190 | Fair 84.5% |
| Zimbabweans | 28.7 /100 | #191 | Fair 84.5% |
| English | 25.8 /100 | #192 | Fair 84.5% |
| South American Indians | 25.0 /100 | #193 | Fair 84.5% |
| Portuguese | 21.2 /100 | #194 | Fair 84.4% |
| Immigrants | Israel | 20.8 /100 | #195 | Fair 84.4% |
| Immigrants | South Eastern Asia | 19.5 /100 | #196 | Poor 84.4% |
| Tlingit-Haida | 19.3 /100 | #197 | Poor 84.4% |
| Immigrants | Iraq | 19.0 /100 | #198 | Poor 84.4% |
| Immigrants | Germany | 18.3 /100 | #199 | Poor 84.4% |
| Immigrants | Kazakhstan | 17.5 /100 | #200 | Poor 84.4% |