Immigrants from Armenia vs Scotch-Irish Associate's Degree
COMPARE
Immigrants from Armenia
Scotch-Irish
Associate's Degree
Associate's Degree Comparison
Immigrants from Armenia
Scotch-Irish
47.4%
ASSOCIATE'S DEGREE
76.6/ 100
METRIC RATING
149th/ 347
METRIC RANK
45.3%
ASSOCIATE'S DEGREE
22.3/ 100
METRIC RATING
197th/ 347
METRIC RANK
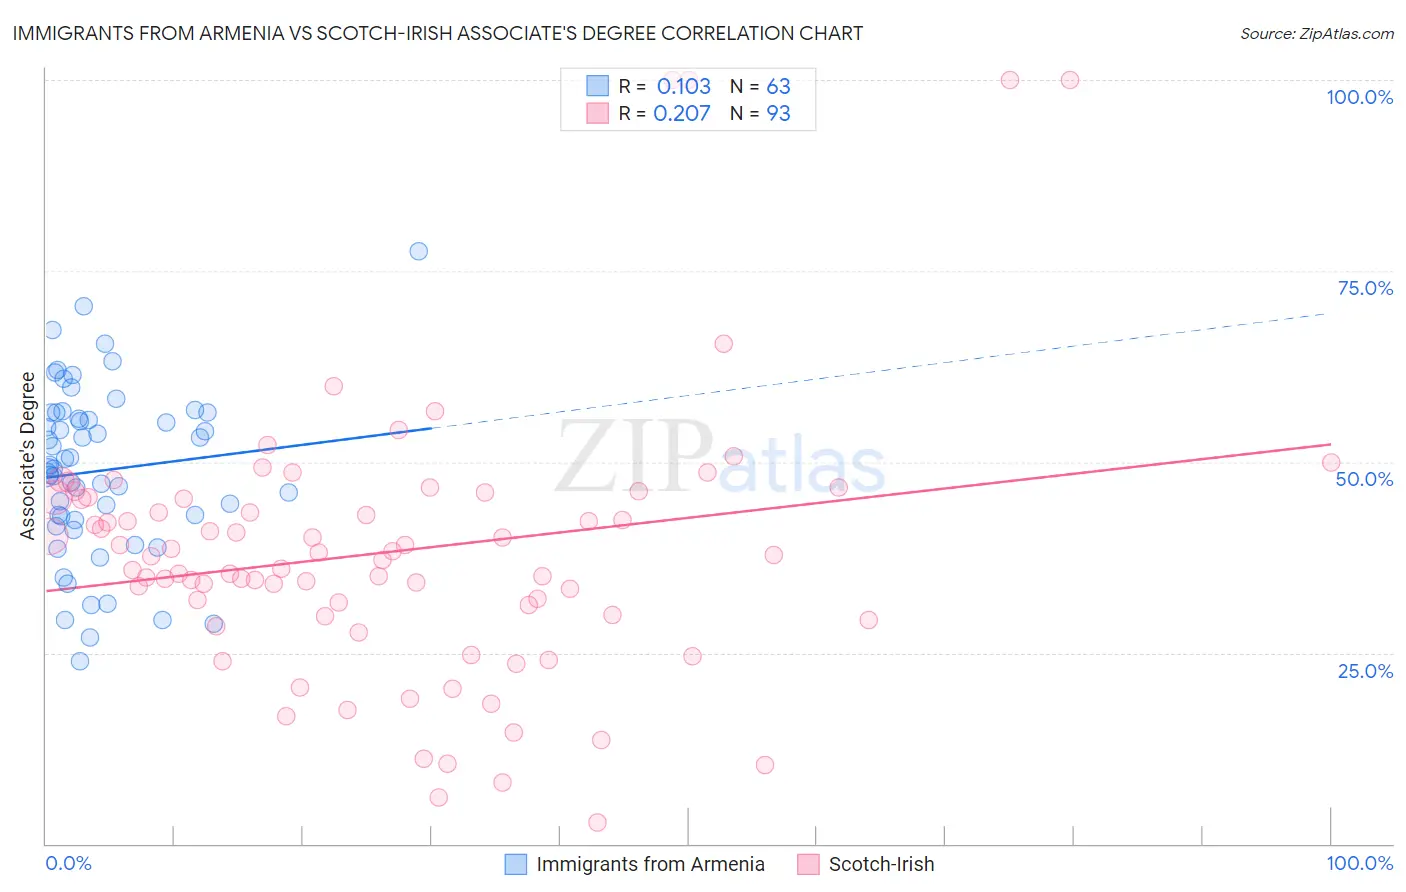
Immigrants from Armenia vs Scotch-Irish Associate's Degree Correlation Chart
The statistical analysis conducted on geographies consisting of 97,722,982 people shows a poor positive correlation between the proportion of Immigrants from Armenia and percentage of population with at least associate's degree education in the United States with a correlation coefficient (R) of 0.103 and weighted average of 47.4%. Similarly, the statistical analysis conducted on geographies consisting of 548,737,246 people shows a weak positive correlation between the proportion of Scotch-Irish and percentage of population with at least associate's degree education in the United States with a correlation coefficient (R) of 0.207 and weighted average of 45.3%, a difference of 4.7%.
Associate's Degree Correlation Summary
| Measurement | Immigrants from Armenia | Scotch-Irish |
| Minimum | 23.8% | 2.9% |
| Maximum | 77.6% | 100.0% |
| Range | 53.7% | 97.1% |
| Mean | 48.9% | 38.2% |
| Median | 49.2% | 37.7% |
| Interquartile 25% (IQ1) | 42.3% | 29.9% |
| Interquartile 75% (IQ3) | 56.4% | 45.3% |
| Interquartile Range (IQR) | 14.1% | 15.5% |
| Standard Deviation (Sample) | 11.1% | 17.9% |
| Standard Deviation (Population) | 11.0% | 17.8% |
Similar Demographics by Associate's Degree
Demographics Similar to Immigrants from Armenia by Associate's Degree
In terms of associate's degree, the demographic groups most similar to Immigrants from Armenia are South American Indian (47.4%, a difference of 0.010%), Iraqi (47.4%, a difference of 0.040%), Immigrants from North Macedonia (47.4%, a difference of 0.060%), Danish (47.4%, a difference of 0.070%), and Immigrants from Sudan (47.4%, a difference of 0.13%).
| Demographics | Rating | Rank | Associate's Degree |
| Sierra Leoneans | 82.9 /100 | #142 | Excellent 47.7% |
| Norwegians | 81.0 /100 | #143 | Excellent 47.6% |
| Slavs | 80.5 /100 | #144 | Excellent 47.6% |
| Canadians | 79.0 /100 | #145 | Good 47.5% |
| Immigrants | Sudan | 77.9 /100 | #146 | Good 47.4% |
| Danes | 77.3 /100 | #147 | Good 47.4% |
| South American Indians | 76.7 /100 | #148 | Good 47.4% |
| Immigrants | Armenia | 76.6 /100 | #149 | Good 47.4% |
| Iraqis | 76.2 /100 | #150 | Good 47.4% |
| Immigrants | North Macedonia | 76.0 /100 | #151 | Good 47.4% |
| Immigrants | Afghanistan | 74.3 /100 | #152 | Good 47.3% |
| Czechs | 72.2 /100 | #153 | Good 47.2% |
| Immigrants | Kenya | 72.1 /100 | #154 | Good 47.2% |
| Kenyans | 70.6 /100 | #155 | Good 47.1% |
| South Americans | 70.5 /100 | #156 | Good 47.1% |
Demographics Similar to Scotch-Irish by Associate's Degree
In terms of associate's degree, the demographic groups most similar to Scotch-Irish are Immigrants from Bangladesh (45.2%, a difference of 0.10%), Immigrants from Senegal (45.2%, a difference of 0.12%), Senegalese (45.2%, a difference of 0.13%), Immigrants from Vietnam (45.2%, a difference of 0.16%), and Spaniard (45.2%, a difference of 0.21%).
| Demographics | Rating | Rank | Associate's Degree |
| Vietnamese | 34.0 /100 | #190 | Fair 45.8% |
| Koreans | 33.8 /100 | #191 | Fair 45.8% |
| Celtics | 33.3 /100 | #192 | Fair 45.8% |
| Immigrants | Cameroon | 31.0 /100 | #193 | Fair 45.7% |
| Immigrants | Peru | 27.6 /100 | #194 | Fair 45.5% |
| Germans | 26.5 /100 | #195 | Fair 45.5% |
| French | 25.6 /100 | #196 | Fair 45.4% |
| Scotch-Irish | 22.3 /100 | #197 | Fair 45.3% |
| Immigrants | Bangladesh | 21.3 /100 | #198 | Fair 45.2% |
| Immigrants | Senegal | 21.2 /100 | #199 | Fair 45.2% |
| Senegalese | 21.1 /100 | #200 | Fair 45.2% |
| Immigrants | Vietnam | 20.8 /100 | #201 | Fair 45.2% |
| Spaniards | 20.4 /100 | #202 | Fair 45.2% |
| Immigrants | South Eastern Asia | 20.2 /100 | #203 | Fair 45.2% |
| Nigerians | 19.1 /100 | #204 | Poor 45.1% |