Dutch vs Immigrants from Kazakhstan Master's Degree
COMPARE
Dutch
Immigrants from Kazakhstan
Master's Degree
Master's Degree Comparison
Dutch
Immigrants from Kazakhstan
13.8%
MASTER'S DEGREE
8.7/ 100
METRIC RATING
230th/ 347
METRIC RANK
18.0%
MASTER'S DEGREE
99.8/ 100
METRIC RATING
65th/ 347
METRIC RANK
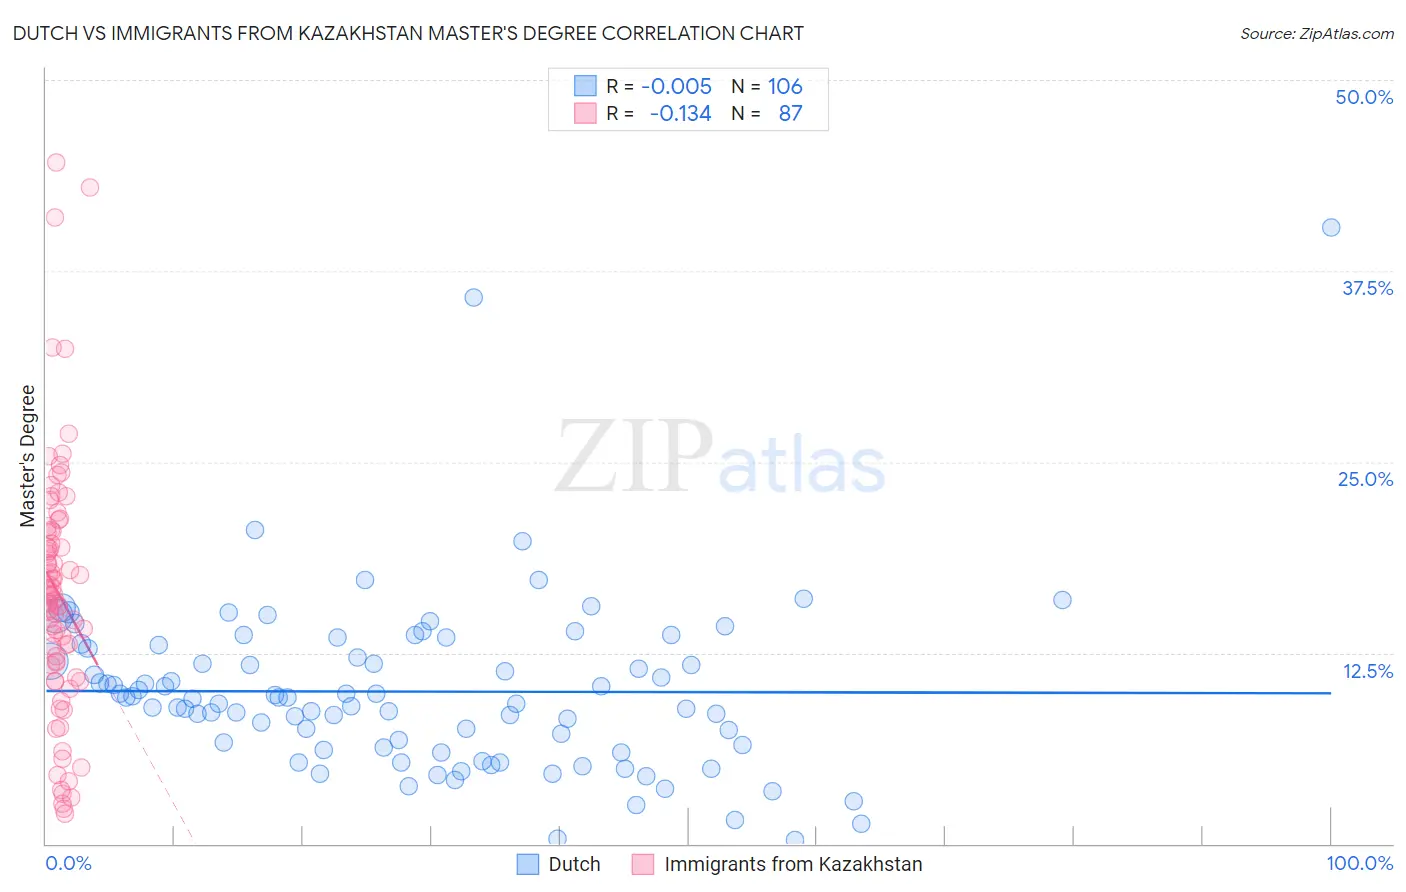
Dutch vs Immigrants from Kazakhstan Master's Degree Correlation Chart
The statistical analysis conducted on geographies consisting of 553,710,662 people shows no correlation between the proportion of Dutch and percentage of population with at least master's degree education in the United States with a correlation coefficient (R) of -0.005 and weighted average of 13.8%. Similarly, the statistical analysis conducted on geographies consisting of 124,419,458 people shows a poor negative correlation between the proportion of Immigrants from Kazakhstan and percentage of population with at least master's degree education in the United States with a correlation coefficient (R) of -0.134 and weighted average of 18.0%, a difference of 30.2%.
Master's Degree Correlation Summary
| Measurement | Dutch | Immigrants from Kazakhstan |
| Minimum | 0.26% | 1.9% |
| Maximum | 40.4% | 44.6% |
| Range | 40.1% | 42.7% |
| Mean | 10.0% | 16.4% |
| Median | 9.5% | 16.2% |
| Interquartile 25% (IQ1) | 6.3% | 11.7% |
| Interquartile 75% (IQ3) | 12.8% | 20.5% |
| Interquartile Range (IQR) | 6.5% | 8.7% |
| Standard Deviation (Sample) | 5.7% | 8.3% |
| Standard Deviation (Population) | 5.7% | 8.2% |
Similar Demographics by Master's Degree
Demographics Similar to Dutch by Master's Degree
In terms of master's degree, the demographic groups most similar to Dutch are British West Indian (13.8%, a difference of 0.030%), White/Caucasian (13.8%, a difference of 0.14%), Immigrants from West Indies (13.9%, a difference of 0.45%), Guyanese (13.7%, a difference of 0.55%), and Immigrants from St. Vincent and the Grenadines (13.9%, a difference of 0.89%).
| Demographics | Rating | Rank | Master's Degree |
| Immigrants | South Eastern Asia | 11.9 /100 | #223 | Poor 14.0% |
| Immigrants | Grenada | 11.8 /100 | #224 | Poor 14.0% |
| Portuguese | 11.2 /100 | #225 | Poor 13.9% |
| Immigrants | St. Vincent and the Grenadines | 11.0 /100 | #226 | Poor 13.9% |
| Immigrants | West Indies | 9.8 /100 | #227 | Tragic 13.9% |
| Whites/Caucasians | 9.1 /100 | #228 | Tragic 13.8% |
| British West Indians | 8.8 /100 | #229 | Tragic 13.8% |
| Dutch | 8.7 /100 | #230 | Tragic 13.8% |
| Guyanese | 7.6 /100 | #231 | Tragic 13.7% |
| Immigrants | Philippines | 6.0 /100 | #232 | Tragic 13.6% |
| Immigrants | Ecuador | 5.7 /100 | #233 | Tragic 13.6% |
| Immigrants | Burma/Myanmar | 5.0 /100 | #234 | Tragic 13.5% |
| German Russians | 4.5 /100 | #235 | Tragic 13.5% |
| Immigrants | Guyana | 4.4 /100 | #236 | Tragic 13.4% |
| Jamaicans | 4.1 /100 | #237 | Tragic 13.4% |
Demographics Similar to Immigrants from Kazakhstan by Master's Degree
In terms of master's degree, the demographic groups most similar to Immigrants from Kazakhstan are Ethiopian (18.0%, a difference of 0.020%), Immigrants from Argentina (18.0%, a difference of 0.070%), Immigrants from Ethiopia (17.9%, a difference of 0.30%), Immigrants from Uzbekistan (17.9%, a difference of 0.62%), and South African (18.1%, a difference of 0.70%).
| Demographics | Rating | Rank | Master's Degree |
| Australians | 99.9 /100 | #58 | Exceptional 18.4% |
| Immigrants | Bulgaria | 99.9 /100 | #59 | Exceptional 18.3% |
| New Zealanders | 99.9 /100 | #60 | Exceptional 18.3% |
| Immigrants | Europe | 99.9 /100 | #61 | Exceptional 18.2% |
| Argentineans | 99.9 /100 | #62 | Exceptional 18.2% |
| Immigrants | Netherlands | 99.9 /100 | #63 | Exceptional 18.1% |
| South Africans | 99.9 /100 | #64 | Exceptional 18.1% |
| Immigrants | Kazakhstan | 99.8 /100 | #65 | Exceptional 18.0% |
| Ethiopians | 99.8 /100 | #66 | Exceptional 18.0% |
| Immigrants | Argentina | 99.8 /100 | #67 | Exceptional 18.0% |
| Immigrants | Ethiopia | 99.8 /100 | #68 | Exceptional 17.9% |
| Immigrants | Uzbekistan | 99.8 /100 | #69 | Exceptional 17.9% |
| Immigrants | Western Europe | 99.8 /100 | #70 | Exceptional 17.8% |
| Immigrants | Pakistan | 99.7 /100 | #71 | Exceptional 17.8% |
| Lithuanians | 99.7 /100 | #72 | Exceptional 17.7% |