Immigrants from Armenia vs Finnish Associate's Degree
COMPARE
Immigrants from Armenia
Finnish
Associate's Degree
Associate's Degree Comparison
Immigrants from Armenia
Finns
47.4%
ASSOCIATE'S DEGREE
76.6/ 100
METRIC RATING
149th/ 347
METRIC RANK
46.3%
ASSOCIATE'S DEGREE
48.5/ 100
METRIC RATING
176th/ 347
METRIC RANK
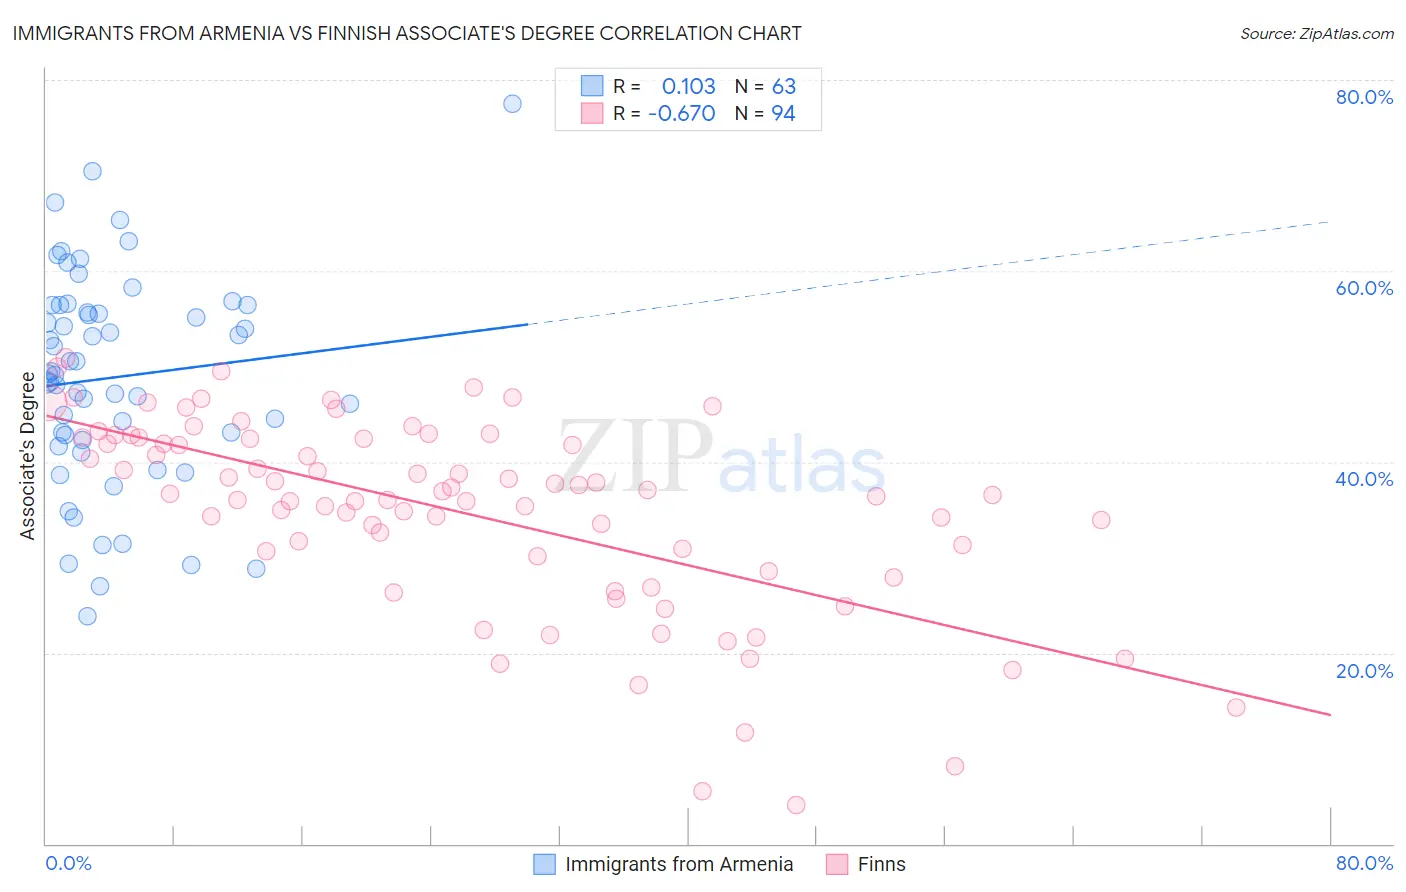
Immigrants from Armenia vs Finnish Associate's Degree Correlation Chart
The statistical analysis conducted on geographies consisting of 97,722,982 people shows a poor positive correlation between the proportion of Immigrants from Armenia and percentage of population with at least associate's degree education in the United States with a correlation coefficient (R) of 0.103 and weighted average of 47.4%. Similarly, the statistical analysis conducted on geographies consisting of 404,653,186 people shows a significant negative correlation between the proportion of Finns and percentage of population with at least associate's degree education in the United States with a correlation coefficient (R) of -0.670 and weighted average of 46.3%, a difference of 2.3%.
Associate's Degree Correlation Summary
| Measurement | Immigrants from Armenia | Finnish |
| Minimum | 23.8% | 4.1% |
| Maximum | 77.6% | 50.9% |
| Range | 53.7% | 46.8% |
| Mean | 48.9% | 34.7% |
| Median | 49.2% | 36.6% |
| Interquartile 25% (IQ1) | 42.3% | 30.2% |
| Interquartile 75% (IQ3) | 56.4% | 42.4% |
| Interquartile Range (IQR) | 14.1% | 12.3% |
| Standard Deviation (Sample) | 11.1% | 10.2% |
| Standard Deviation (Population) | 11.0% | 10.1% |
Similar Demographics by Associate's Degree
Demographics Similar to Immigrants from Armenia by Associate's Degree
In terms of associate's degree, the demographic groups most similar to Immigrants from Armenia are South American Indian (47.4%, a difference of 0.010%), Iraqi (47.4%, a difference of 0.040%), Immigrants from North Macedonia (47.4%, a difference of 0.060%), Danish (47.4%, a difference of 0.070%), and Immigrants from Sudan (47.4%, a difference of 0.13%).
| Demographics | Rating | Rank | Associate's Degree |
| Sierra Leoneans | 82.9 /100 | #142 | Excellent 47.7% |
| Norwegians | 81.0 /100 | #143 | Excellent 47.6% |
| Slavs | 80.5 /100 | #144 | Excellent 47.6% |
| Canadians | 79.0 /100 | #145 | Good 47.5% |
| Immigrants | Sudan | 77.9 /100 | #146 | Good 47.4% |
| Danes | 77.3 /100 | #147 | Good 47.4% |
| South American Indians | 76.7 /100 | #148 | Good 47.4% |
| Immigrants | Armenia | 76.6 /100 | #149 | Good 47.4% |
| Iraqis | 76.2 /100 | #150 | Good 47.4% |
| Immigrants | North Macedonia | 76.0 /100 | #151 | Good 47.4% |
| Immigrants | Afghanistan | 74.3 /100 | #152 | Good 47.3% |
| Czechs | 72.2 /100 | #153 | Good 47.2% |
| Immigrants | Kenya | 72.1 /100 | #154 | Good 47.2% |
| Kenyans | 70.6 /100 | #155 | Good 47.1% |
| South Americans | 70.5 /100 | #156 | Good 47.1% |
Demographics Similar to Finns by Associate's Degree
In terms of associate's degree, the demographic groups most similar to Finns are Slovak (46.3%, a difference of 0.010%), Belgian (46.3%, a difference of 0.020%), Immigrants from Bosnia and Herzegovina (46.3%, a difference of 0.020%), Sri Lankan (46.3%, a difference of 0.070%), and English (46.4%, a difference of 0.11%).
| Demographics | Rating | Rank | Associate's Degree |
| Uruguayans | 55.4 /100 | #169 | Average 46.5% |
| Irish | 53.6 /100 | #170 | Average 46.5% |
| Basques | 52.8 /100 | #171 | Average 46.5% |
| Peruvians | 50.5 /100 | #172 | Average 46.4% |
| Immigrants | Iraq | 50.3 /100 | #173 | Average 46.4% |
| English | 50.0 /100 | #174 | Average 46.4% |
| Belgians | 48.9 /100 | #175 | Average 46.3% |
| Finns | 48.5 /100 | #176 | Average 46.3% |
| Slovaks | 48.4 /100 | #177 | Average 46.3% |
| Immigrants | Bosnia and Herzegovina | 48.3 /100 | #178 | Average 46.3% |
| Sri Lankans | 47.6 /100 | #179 | Average 46.3% |
| Bermudans | 46.4 /100 | #180 | Average 46.2% |
| Immigrants | Colombia | 41.3 /100 | #181 | Average 46.0% |
| Swiss | 40.4 /100 | #182 | Average 46.0% |
| Yugoslavians | 40.2 /100 | #183 | Average 46.0% |