Maltese vs Immigrants from Afghanistan Unemployment Among Ages 20 to 24 years
COMPARE
Maltese
Immigrants from Afghanistan
Unemployment Among Ages 20 to 24 years
Unemployment Among Ages 20 to 24 years Comparison
Maltese
Immigrants from Afghanistan
11.2%
UNEMPLOYMENT AMONG AGES 20 TO 24 YEARS
0.0/ 100
METRIC RATING
268th/ 347
METRIC RANK
9.5%
UNEMPLOYMENT AMONG AGES 20 TO 24 YEARS
100.0/ 100
METRIC RATING
28th/ 347
METRIC RANK
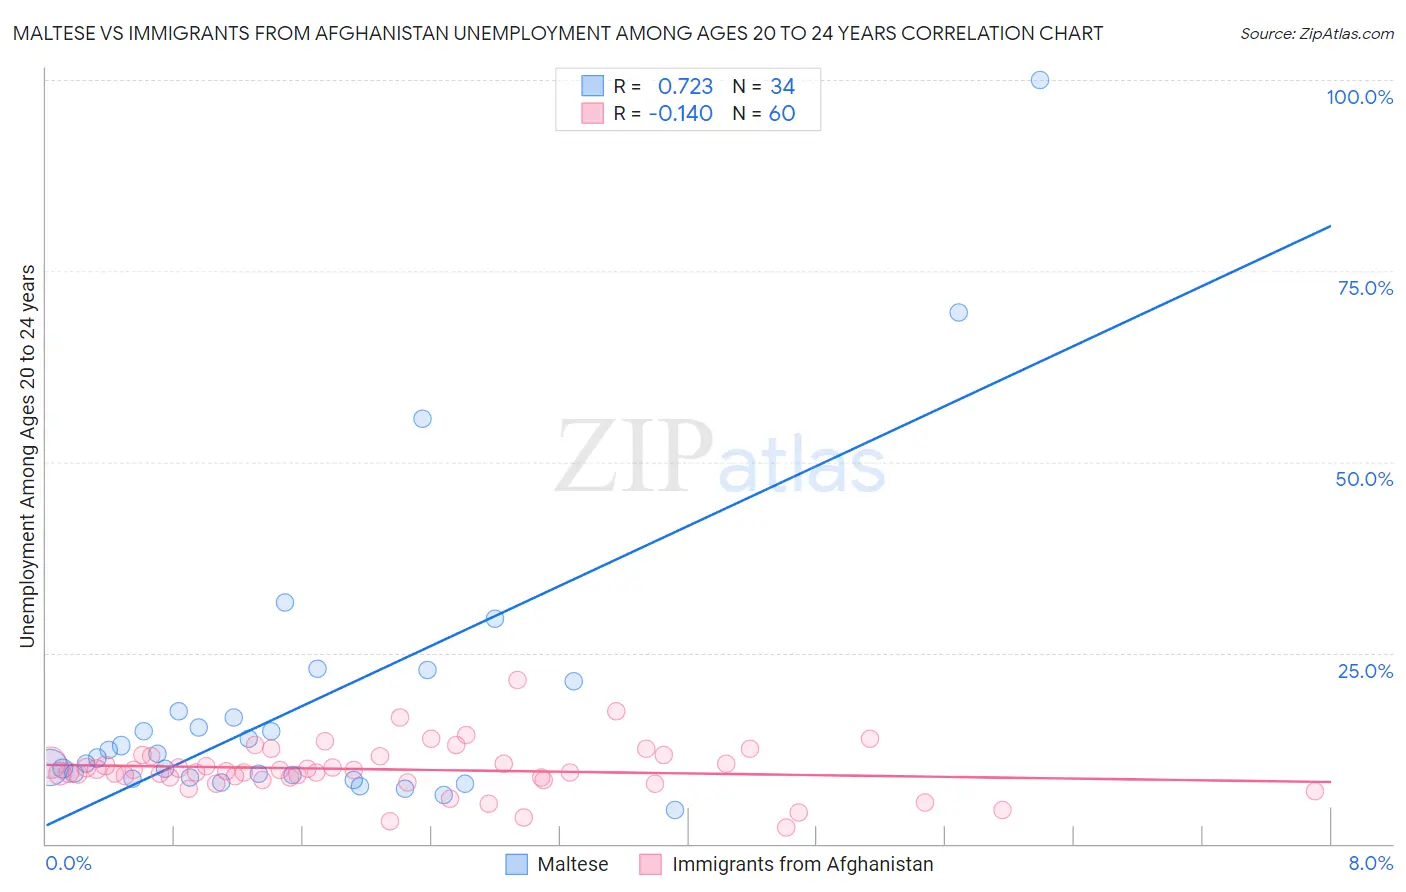
Maltese vs Immigrants from Afghanistan Unemployment Among Ages 20 to 24 years Correlation Chart
The statistical analysis conducted on geographies consisting of 124,902,800 people shows a strong positive correlation between the proportion of Maltese and unemployment rate among population between the ages 20 and 24 in the United States with a correlation coefficient (R) of 0.723 and weighted average of 11.2%. Similarly, the statistical analysis conducted on geographies consisting of 146,435,926 people shows a poor negative correlation between the proportion of Immigrants from Afghanistan and unemployment rate among population between the ages 20 and 24 in the United States with a correlation coefficient (R) of -0.140 and weighted average of 9.5%, a difference of 17.3%.
Unemployment Among Ages 20 to 24 years Correlation Summary
| Measurement | Maltese | Immigrants from Afghanistan |
| Minimum | 4.4% | 2.1% |
| Maximum | 100.0% | 21.4% |
| Range | 95.6% | 19.3% |
| Mean | 18.5% | 9.7% |
| Median | 11.5% | 9.4% |
| Interquartile 25% (IQ1) | 8.6% | 8.5% |
| Interquartile 75% (IQ3) | 17.3% | 11.4% |
| Interquartile Range (IQR) | 8.6% | 2.9% |
| Standard Deviation (Sample) | 19.7% | 3.3% |
| Standard Deviation (Population) | 19.4% | 3.3% |
Similar Demographics by Unemployment Among Ages 20 to 24 years
Demographics Similar to Maltese by Unemployment Among Ages 20 to 24 years
In terms of unemployment among ages 20 to 24 years, the demographic groups most similar to Maltese are Ute (11.2%, a difference of 0.39%), Immigrants from Greece (11.1%, a difference of 0.44%), Immigrants from Liberia (11.1%, a difference of 0.72%), Immigrants from Ireland (11.1%, a difference of 0.82%), and Subsaharan African (11.1%, a difference of 0.89%).
| Demographics | Rating | Rank | Unemployment Among Ages 20 to 24 years |
| Puget Sound Salish | 0.2 /100 | #261 | Tragic 10.9% |
| Immigrants | Latin America | 0.1 /100 | #262 | Tragic 11.0% |
| Marshallese | 0.1 /100 | #263 | Tragic 11.0% |
| Sub-Saharan Africans | 0.0 /100 | #264 | Tragic 11.1% |
| Immigrants | Ireland | 0.0 /100 | #265 | Tragic 11.1% |
| Immigrants | Liberia | 0.0 /100 | #266 | Tragic 11.1% |
| Immigrants | Greece | 0.0 /100 | #267 | Tragic 11.1% |
| Maltese | 0.0 /100 | #268 | Tragic 11.2% |
| Ute | 0.0 /100 | #269 | Tragic 11.2% |
| Delaware | 0.0 /100 | #270 | Tragic 11.3% |
| Immigrants | Uzbekistan | 0.0 /100 | #271 | Tragic 11.4% |
| Nigerians | 0.0 /100 | #272 | Tragic 11.4% |
| Immigrants | Nigeria | 0.0 /100 | #273 | Tragic 11.5% |
| Cape Verdeans | 0.0 /100 | #274 | Tragic 11.5% |
| Senegalese | 0.0 /100 | #275 | Tragic 11.5% |
Demographics Similar to Immigrants from Afghanistan by Unemployment Among Ages 20 to 24 years
In terms of unemployment among ages 20 to 24 years, the demographic groups most similar to Immigrants from Afghanistan are Immigrants from North Macedonia (9.5%, a difference of 0.010%), Scandinavian (9.5%, a difference of 0.020%), Immigrants from Zimbabwe (9.5%, a difference of 0.080%), Immigrants from Eastern Africa (9.5%, a difference of 0.11%), and Cambodian (9.5%, a difference of 0.15%).
| Demographics | Rating | Rank | Unemployment Among Ages 20 to 24 years |
| Immigrants | Bosnia and Herzegovina | 100.0 /100 | #21 | Exceptional 9.4% |
| Tongans | 100.0 /100 | #22 | Exceptional 9.4% |
| Immigrants | Nepal | 100.0 /100 | #23 | Exceptional 9.4% |
| Taiwanese | 100.0 /100 | #24 | Exceptional 9.4% |
| Immigrants | Eritrea | 100.0 /100 | #25 | Exceptional 9.5% |
| Swedes | 100.0 /100 | #26 | Exceptional 9.5% |
| Immigrants | Zimbabwe | 100.0 /100 | #27 | Exceptional 9.5% |
| Immigrants | Afghanistan | 100.0 /100 | #28 | Exceptional 9.5% |
| Immigrants | North Macedonia | 100.0 /100 | #29 | Exceptional 9.5% |
| Scandinavians | 100.0 /100 | #30 | Exceptional 9.5% |
| Immigrants | Eastern Africa | 100.0 /100 | #31 | Exceptional 9.5% |
| Cambodians | 100.0 /100 | #32 | Exceptional 9.5% |
| Australians | 100.0 /100 | #33 | Exceptional 9.6% |
| Yugoslavians | 100.0 /100 | #34 | Exceptional 9.6% |
| Germans | 100.0 /100 | #35 | Exceptional 9.6% |