Immigrants from Malaysia vs Immigrants from Afghanistan 9th Grade
COMPARE
Immigrants from Malaysia
Immigrants from Afghanistan
9th Grade
9th Grade Comparison
Immigrants from Malaysia
Immigrants from Afghanistan
94.5%
9TH GRADE
12.2/ 100
METRIC RATING
212th/ 347
METRIC RANK
94.0%
9TH GRADE
0.5/ 100
METRIC RATING
256th/ 347
METRIC RANK
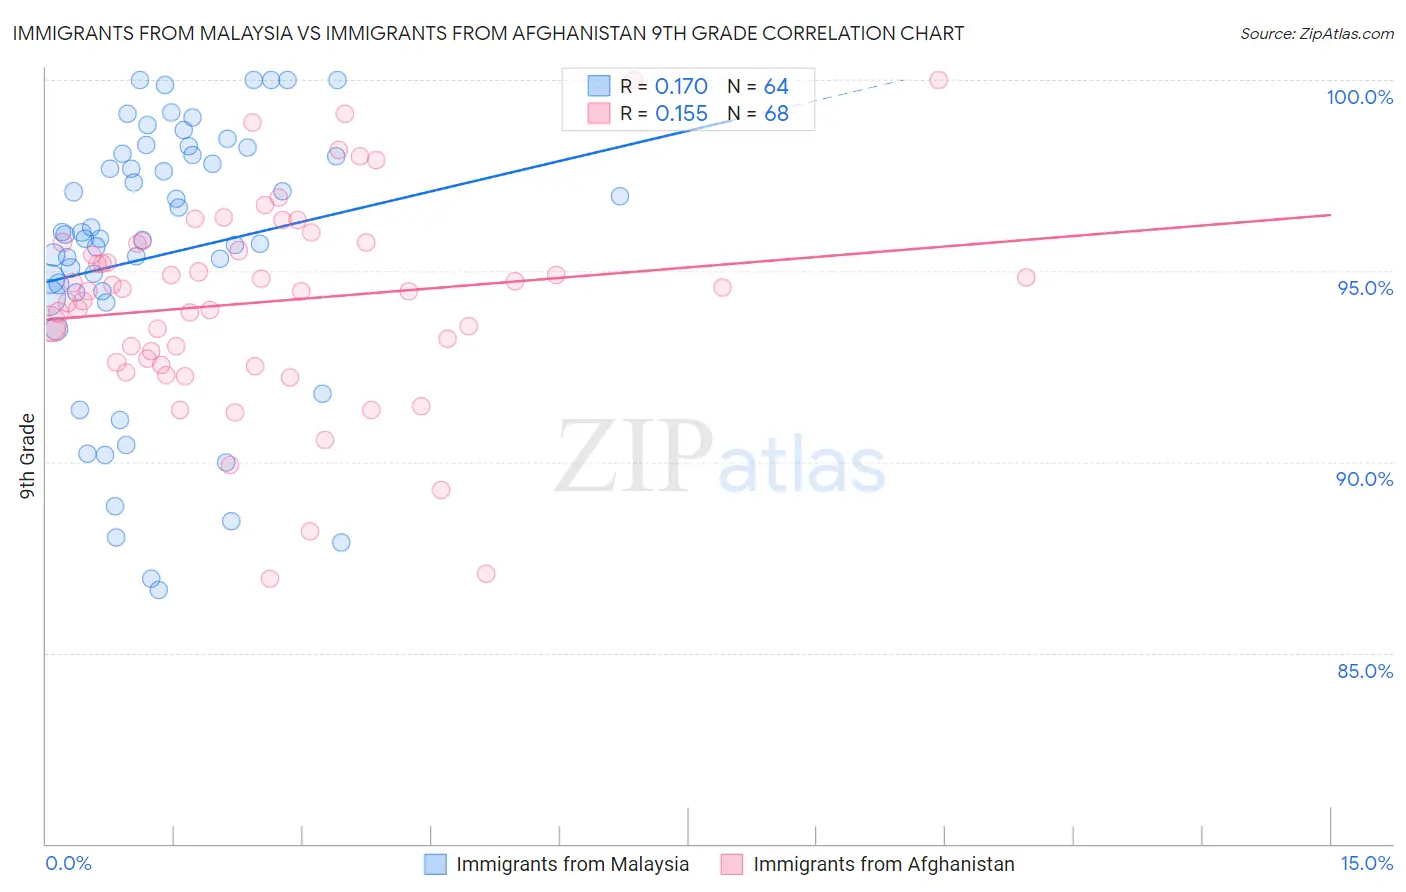
Immigrants from Malaysia vs Immigrants from Afghanistan 9th Grade Correlation Chart
The statistical analysis conducted on geographies consisting of 197,973,854 people shows a poor positive correlation between the proportion of Immigrants from Malaysia and percentage of population with at least 9th grade education in the United States with a correlation coefficient (R) of 0.170 and weighted average of 94.5%. Similarly, the statistical analysis conducted on geographies consisting of 147,629,924 people shows a poor positive correlation between the proportion of Immigrants from Afghanistan and percentage of population with at least 9th grade education in the United States with a correlation coefficient (R) of 0.155 and weighted average of 94.0%, a difference of 0.60%.
9th Grade Correlation Summary
| Measurement | Immigrants from Malaysia | Immigrants from Afghanistan |
| Minimum | 86.6% | 86.9% |
| Maximum | 100.0% | 100.0% |
| Range | 13.4% | 13.1% |
| Mean | 95.4% | 94.2% |
| Median | 95.9% | 94.5% |
| Interquartile 25% (IQ1) | 94.4% | 92.7% |
| Interquartile 75% (IQ3) | 98.1% | 95.7% |
| Interquartile Range (IQR) | 3.7% | 3.1% |
| Standard Deviation (Sample) | 3.6% | 2.7% |
| Standard Deviation (Population) | 3.5% | 2.6% |
Similar Demographics by 9th Grade
Demographics Similar to Immigrants from Malaysia by 9th Grade
In terms of 9th grade, the demographic groups most similar to Immigrants from Malaysia are Immigrants from Indonesia (94.5%, a difference of 0.0%), Immigrants from Oceania (94.5%, a difference of 0.0%), Immigrants from Liberia (94.5%, a difference of 0.010%), Immigrants from Chile (94.5%, a difference of 0.020%), and Immigrants from Syria (94.5%, a difference of 0.020%).
| Demographics | Rating | Rank | 9th Grade |
| Immigrants | Sudan | 17.6 /100 | #205 | Poor 94.6% |
| Samoans | 17.3 /100 | #206 | Poor 94.6% |
| Immigrants | Morocco | 16.3 /100 | #207 | Poor 94.6% |
| Immigrants | Pakistan | 15.5 /100 | #208 | Poor 94.6% |
| Comanche | 14.9 /100 | #209 | Poor 94.6% |
| Immigrants | Chile | 13.4 /100 | #210 | Poor 94.5% |
| Immigrants | Indonesia | 12.3 /100 | #211 | Poor 94.5% |
| Immigrants | Malaysia | 12.2 /100 | #212 | Poor 94.5% |
| Immigrants | Oceania | 12.1 /100 | #213 | Poor 94.5% |
| Immigrants | Liberia | 11.8 /100 | #214 | Poor 94.5% |
| Immigrants | Syria | 11.0 /100 | #215 | Poor 94.5% |
| Immigrants | Western Asia | 10.7 /100 | #216 | Poor 94.5% |
| Asians | 9.9 /100 | #217 | Tragic 94.5% |
| Portuguese | 9.2 /100 | #218 | Tragic 94.5% |
| Africans | 9.0 /100 | #219 | Tragic 94.5% |
Demographics Similar to Immigrants from Afghanistan by 9th Grade
In terms of 9th grade, the demographic groups most similar to Immigrants from Afghanistan are Immigrants from Nigeria (94.0%, a difference of 0.010%), Immigrants from Costa Rica (94.0%, a difference of 0.020%), Immigrants from Thailand (93.9%, a difference of 0.020%), Ghanaian (93.9%, a difference of 0.020%), and Pima (93.9%, a difference of 0.040%).
| Demographics | Rating | Rank | 9th Grade |
| Uruguayans | 1.3 /100 | #249 | Tragic 94.1% |
| Immigrants | Hong Kong | 1.3 /100 | #250 | Tragic 94.1% |
| Jamaicans | 1.0 /100 | #251 | Tragic 94.1% |
| Immigrants | Senegal | 0.9 /100 | #252 | Tragic 94.1% |
| Colombians | 0.8 /100 | #253 | Tragic 94.0% |
| U.S. Virgin Islanders | 0.7 /100 | #254 | Tragic 94.0% |
| Immigrants | Nigeria | 0.6 /100 | #255 | Tragic 94.0% |
| Immigrants | Afghanistan | 0.5 /100 | #256 | Tragic 94.0% |
| Immigrants | Costa Rica | 0.5 /100 | #257 | Tragic 94.0% |
| Immigrants | Thailand | 0.5 /100 | #258 | Tragic 93.9% |
| Ghanaians | 0.5 /100 | #259 | Tragic 93.9% |
| Pima | 0.4 /100 | #260 | Tragic 93.9% |
| South Americans | 0.4 /100 | #261 | Tragic 93.9% |
| Immigrants | Jamaica | 0.4 /100 | #262 | Tragic 93.9% |
| Immigrants | Uzbekistan | 0.4 /100 | #263 | Tragic 93.9% |