Macedonian vs Immigrants from Zimbabwe Nursery School
COMPARE
Macedonian
Immigrants from Zimbabwe
Nursery School
Nursery School Comparison
Macedonians
Immigrants from Zimbabwe
98.3%
NURSERY SCHOOL
98.7/ 100
METRIC RATING
92nd/ 347
METRIC RANK
98.2%
NURSERY SCHOOL
94.2/ 100
METRIC RATING
121st/ 347
METRIC RANK
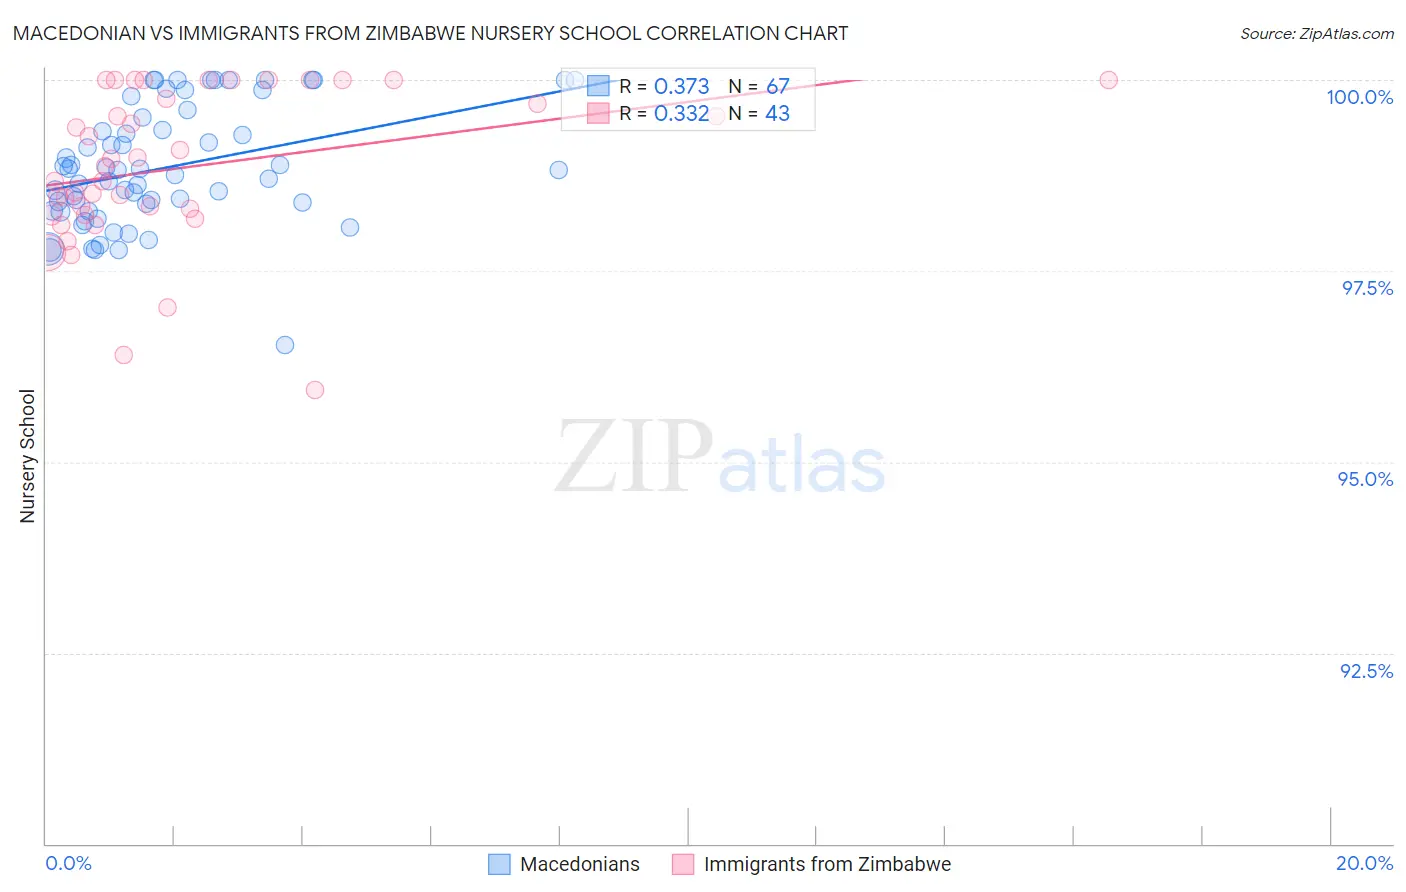
Macedonian vs Immigrants from Zimbabwe Nursery School Correlation Chart
The statistical analysis conducted on geographies consisting of 132,590,497 people shows a mild positive correlation between the proportion of Macedonians and percentage of population with at least nursery school education in the United States with a correlation coefficient (R) of 0.373 and weighted average of 98.3%. Similarly, the statistical analysis conducted on geographies consisting of 117,756,150 people shows a mild positive correlation between the proportion of Immigrants from Zimbabwe and percentage of population with at least nursery school education in the United States with a correlation coefficient (R) of 0.332 and weighted average of 98.2%, a difference of 0.12%.
Nursery School Correlation Summary
| Measurement | Macedonian | Immigrants from Zimbabwe |
| Minimum | 96.5% | 95.9% |
| Maximum | 100.0% | 100.0% |
| Range | 3.5% | 4.1% |
| Mean | 98.9% | 98.9% |
| Median | 98.8% | 98.9% |
| Interquartile 25% (IQ1) | 98.3% | 98.2% |
| Interquartile 75% (IQ3) | 99.5% | 100.0% |
| Interquartile Range (IQR) | 1.2% | 1.8% |
| Standard Deviation (Sample) | 0.78% | 1.0% |
| Standard Deviation (Population) | 0.77% | 1.00% |
Similar Demographics by Nursery School
Demographics Similar to Macedonians by Nursery School
In terms of nursery school, the demographic groups most similar to Macedonians are Immigrants from Western Europe (98.3%, a difference of 0.0%), Zimbabwean (98.3%, a difference of 0.0%), Immigrants from India (98.3%, a difference of 0.0%), Hopi (98.3%, a difference of 0.010%), and Ukrainian (98.3%, a difference of 0.010%).
| Demographics | Rating | Rank | Nursery School |
| Immigrants | Sweden | 99.1 /100 | #85 | Exceptional 98.3% |
| Immigrants | Australia | 99.0 /100 | #86 | Exceptional 98.3% |
| Hopi | 98.9 /100 | #87 | Exceptional 98.3% |
| Ukrainians | 98.9 /100 | #88 | Exceptional 98.3% |
| Immigrants | South Africa | 98.8 /100 | #89 | Exceptional 98.3% |
| Immigrants | Western Europe | 98.8 /100 | #90 | Exceptional 98.3% |
| Zimbabweans | 98.8 /100 | #91 | Exceptional 98.3% |
| Macedonians | 98.7 /100 | #92 | Exceptional 98.3% |
| Immigrants | India | 98.7 /100 | #93 | Exceptional 98.3% |
| Immigrants | Germany | 98.6 /100 | #94 | Exceptional 98.3% |
| South Africans | 98.6 /100 | #95 | Exceptional 98.3% |
| Cypriots | 98.3 /100 | #96 | Exceptional 98.3% |
| Immigrants | Nonimmigrants | 98.3 /100 | #97 | Exceptional 98.3% |
| Choctaw | 98.3 /100 | #98 | Exceptional 98.3% |
| Colville | 98.2 /100 | #99 | Exceptional 98.3% |
Demographics Similar to Immigrants from Zimbabwe by Nursery School
In terms of nursery school, the demographic groups most similar to Immigrants from Zimbabwe are Okinawan (98.2%, a difference of 0.0%), Immigrants from Japan (98.2%, a difference of 0.0%), Syrian (98.2%, a difference of 0.0%), Thai (98.2%, a difference of 0.010%), and Lebanese (98.2%, a difference of 0.010%).
| Demographics | Rating | Rank | Nursery School |
| Ute | 96.4 /100 | #114 | Exceptional 98.2% |
| Iranians | 96.3 /100 | #115 | Exceptional 98.2% |
| Spanish | 95.8 /100 | #116 | Exceptional 98.2% |
| Immigrants | France | 95.6 /100 | #117 | Exceptional 98.2% |
| Yugoslavians | 95.4 /100 | #118 | Exceptional 98.2% |
| Thais | 95.0 /100 | #119 | Exceptional 98.2% |
| Okinawans | 94.5 /100 | #120 | Exceptional 98.2% |
| Immigrants | Zimbabwe | 94.2 /100 | #121 | Exceptional 98.2% |
| Immigrants | Japan | 94.0 /100 | #122 | Exceptional 98.2% |
| Syrians | 93.9 /100 | #123 | Exceptional 98.2% |
| Lebanese | 93.8 /100 | #124 | Exceptional 98.2% |
| Iroquois | 93.7 /100 | #125 | Exceptional 98.2% |
| Menominee | 93.6 /100 | #126 | Exceptional 98.2% |
| Immigrants | Saudi Arabia | 93.4 /100 | #127 | Exceptional 98.2% |
| Immigrants | Serbia | 92.4 /100 | #128 | Exceptional 98.2% |