Macedonian vs Immigrants from Zimbabwe Divorced or Separated
COMPARE
Macedonian
Immigrants from Zimbabwe
Divorced or Separated
Divorced or Separated Comparison
Macedonians
Immigrants from Zimbabwe
11.4%
DIVORCED OR SEPARATED
99.8/ 100
METRIC RATING
64th/ 347
METRIC RANK
11.9%
DIVORCED OR SEPARATED
81.5/ 100
METRIC RATING
142nd/ 347
METRIC RANK
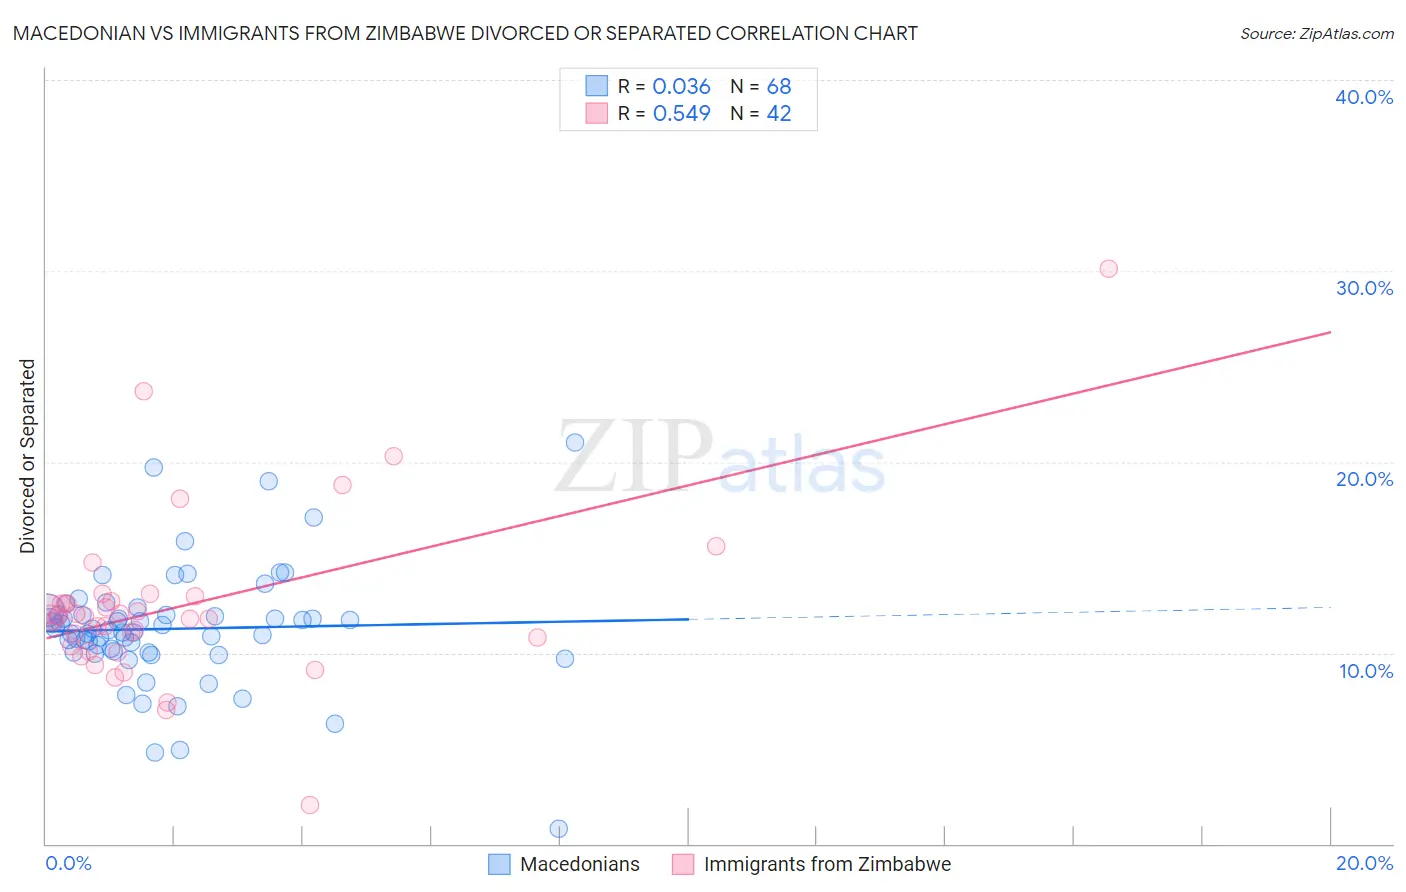
Macedonian vs Immigrants from Zimbabwe Divorced or Separated Correlation Chart
The statistical analysis conducted on geographies consisting of 132,616,839 people shows no correlation between the proportion of Macedonians and percentage of population currently divorced or separated in the United States with a correlation coefficient (R) of 0.036 and weighted average of 11.4%. Similarly, the statistical analysis conducted on geographies consisting of 117,798,531 people shows a substantial positive correlation between the proportion of Immigrants from Zimbabwe and percentage of population currently divorced or separated in the United States with a correlation coefficient (R) of 0.549 and weighted average of 11.9%, a difference of 4.3%.
Divorced or Separated Correlation Summary
| Measurement | Macedonian | Immigrants from Zimbabwe |
| Minimum | 0.80% | 2.0% |
| Maximum | 21.0% | 30.1% |
| Range | 20.2% | 28.1% |
| Mean | 11.3% | 12.4% |
| Median | 11.2% | 11.9% |
| Interquartile 25% (IQ1) | 10.1% | 10.4% |
| Interquartile 75% (IQ3) | 12.0% | 12.7% |
| Interquartile Range (IQR) | 1.9% | 2.4% |
| Standard Deviation (Sample) | 3.1% | 4.5% |
| Standard Deviation (Population) | 3.1% | 4.5% |
Similar Demographics by Divorced or Separated
Demographics Similar to Macedonians by Divorced or Separated
In terms of divorced or separated, the demographic groups most similar to Macedonians are Immigrants from South Eastern Asia (11.4%, a difference of 0.040%), Inupiat (11.4%, a difference of 0.18%), Immigrants from Syria (11.4%, a difference of 0.27%), Palestinian (11.5%, a difference of 0.38%), and Immigrants from Belgium (11.5%, a difference of 0.38%).
| Demographics | Rating | Rank | Divorced or Separated |
| Immigrants | Vietnam | 99.9 /100 | #57 | Exceptional 11.3% |
| Sri Lankans | 99.9 /100 | #58 | Exceptional 11.3% |
| Israelis | 99.9 /100 | #59 | Exceptional 11.3% |
| Immigrants | Russia | 99.9 /100 | #60 | Exceptional 11.3% |
| Koreans | 99.9 /100 | #61 | Exceptional 11.3% |
| Luxembourgers | 99.9 /100 | #62 | Exceptional 11.3% |
| Immigrants | Kuwait | 99.9 /100 | #63 | Exceptional 11.3% |
| Macedonians | 99.8 /100 | #64 | Exceptional 11.4% |
| Immigrants | South Eastern Asia | 99.8 /100 | #65 | Exceptional 11.4% |
| Inupiat | 99.8 /100 | #66 | Exceptional 11.4% |
| Immigrants | Syria | 99.7 /100 | #67 | Exceptional 11.4% |
| Palestinians | 99.7 /100 | #68 | Exceptional 11.5% |
| Immigrants | Belgium | 99.7 /100 | #69 | Exceptional 11.5% |
| Immigrants | Eastern Europe | 99.7 /100 | #70 | Exceptional 11.5% |
| Paraguayans | 99.7 /100 | #71 | Exceptional 11.5% |
Demographics Similar to Immigrants from Zimbabwe by Divorced or Separated
In terms of divorced or separated, the demographic groups most similar to Immigrants from Zimbabwe are Pakistani (11.9%, a difference of 0.010%), Peruvian (11.9%, a difference of 0.030%), Croatian (11.9%, a difference of 0.050%), Immigrants from Morocco (11.9%, a difference of 0.090%), and Lebanese (11.9%, a difference of 0.12%).
| Demographics | Rating | Rank | Divorced or Separated |
| Danes | 84.8 /100 | #135 | Excellent 11.9% |
| Carpatho Rusyns | 84.8 /100 | #136 | Excellent 11.9% |
| Alsatians | 84.0 /100 | #137 | Excellent 11.9% |
| Immigrants | Netherlands | 83.9 /100 | #138 | Excellent 11.9% |
| Australians | 83.6 /100 | #139 | Excellent 11.9% |
| Lebanese | 83.4 /100 | #140 | Excellent 11.9% |
| Immigrants | Morocco | 82.9 /100 | #141 | Excellent 11.9% |
| Immigrants | Zimbabwe | 81.5 /100 | #142 | Excellent 11.9% |
| Pakistanis | 81.3 /100 | #143 | Excellent 11.9% |
| Peruvians | 80.9 /100 | #144 | Excellent 11.9% |
| Croatians | 80.6 /100 | #145 | Excellent 11.9% |
| Immigrants | Grenada | 79.1 /100 | #146 | Good 11.9% |
| Poles | 78.6 /100 | #147 | Good 11.9% |
| Italians | 77.8 /100 | #148 | Good 11.9% |
| Immigrants | Oceania | 77.7 /100 | #149 | Good 11.9% |