Macedonian vs Immigrants from Eastern Europe Nursery School
COMPARE
Macedonian
Immigrants from Eastern Europe
Nursery School
Nursery School Comparison
Macedonians
Immigrants from Eastern Europe
98.3%
NURSERY SCHOOL
98.7/ 100
METRIC RATING
92nd/ 347
METRIC RANK
98.0%
NURSERY SCHOOL
59.7/ 100
METRIC RATING
161st/ 347
METRIC RANK
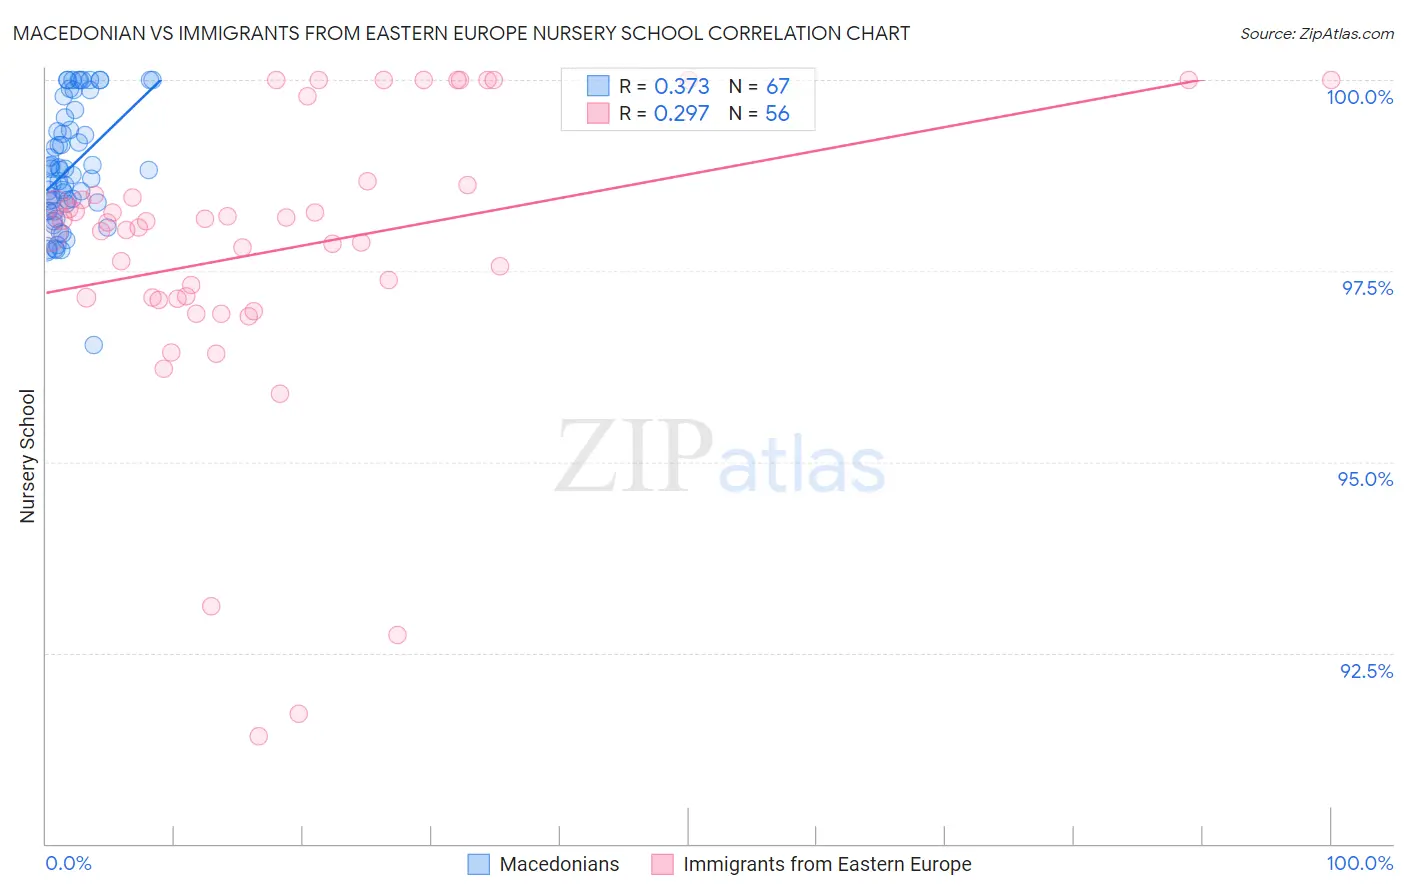
Macedonian vs Immigrants from Eastern Europe Nursery School Correlation Chart
The statistical analysis conducted on geographies consisting of 132,590,497 people shows a mild positive correlation between the proportion of Macedonians and percentage of population with at least nursery school education in the United States with a correlation coefficient (R) of 0.373 and weighted average of 98.3%. Similarly, the statistical analysis conducted on geographies consisting of 475,879,420 people shows a weak positive correlation between the proportion of Immigrants from Eastern Europe and percentage of population with at least nursery school education in the United States with a correlation coefficient (R) of 0.297 and weighted average of 98.0%, a difference of 0.30%.
Nursery School Correlation Summary
| Measurement | Macedonian | Immigrants from Eastern Europe |
| Minimum | 96.5% | 91.4% |
| Maximum | 100.0% | 100.0% |
| Range | 3.5% | 8.6% |
| Mean | 98.9% | 97.8% |
| Median | 98.8% | 98.1% |
| Interquartile 25% (IQ1) | 98.3% | 97.1% |
| Interquartile 75% (IQ3) | 99.5% | 98.6% |
| Interquartile Range (IQR) | 1.2% | 1.4% |
| Standard Deviation (Sample) | 0.78% | 1.9% |
| Standard Deviation (Population) | 0.77% | 1.9% |
Similar Demographics by Nursery School
Demographics Similar to Macedonians by Nursery School
In terms of nursery school, the demographic groups most similar to Macedonians are Immigrants from Western Europe (98.3%, a difference of 0.0%), Zimbabwean (98.3%, a difference of 0.0%), Immigrants from India (98.3%, a difference of 0.0%), Hopi (98.3%, a difference of 0.010%), and Ukrainian (98.3%, a difference of 0.010%).
| Demographics | Rating | Rank | Nursery School |
| Immigrants | Sweden | 99.1 /100 | #85 | Exceptional 98.3% |
| Immigrants | Australia | 99.0 /100 | #86 | Exceptional 98.3% |
| Hopi | 98.9 /100 | #87 | Exceptional 98.3% |
| Ukrainians | 98.9 /100 | #88 | Exceptional 98.3% |
| Immigrants | South Africa | 98.8 /100 | #89 | Exceptional 98.3% |
| Immigrants | Western Europe | 98.8 /100 | #90 | Exceptional 98.3% |
| Zimbabweans | 98.8 /100 | #91 | Exceptional 98.3% |
| Macedonians | 98.7 /100 | #92 | Exceptional 98.3% |
| Immigrants | India | 98.7 /100 | #93 | Exceptional 98.3% |
| Immigrants | Germany | 98.6 /100 | #94 | Exceptional 98.3% |
| South Africans | 98.6 /100 | #95 | Exceptional 98.3% |
| Cypriots | 98.3 /100 | #96 | Exceptional 98.3% |
| Immigrants | Nonimmigrants | 98.3 /100 | #97 | Exceptional 98.3% |
| Choctaw | 98.3 /100 | #98 | Exceptional 98.3% |
| Colville | 98.2 /100 | #99 | Exceptional 98.3% |
Demographics Similar to Immigrants from Eastern Europe by Nursery School
In terms of nursery school, the demographic groups most similar to Immigrants from Eastern Europe are Immigrants from Russia (98.0%, a difference of 0.0%), Brazilian (98.0%, a difference of 0.0%), Immigrants from Italy (98.0%, a difference of 0.0%), French American Indian (98.0%, a difference of 0.010%), and Ugandan (98.0%, a difference of 0.010%).
| Demographics | Rating | Rank | Nursery School |
| Immigrants | Iran | 68.7 /100 | #154 | Good 98.0% |
| Immigrants | South Central Asia | 66.7 /100 | #155 | Good 98.0% |
| Venezuelans | 66.6 /100 | #156 | Good 98.0% |
| Comanche | 66.0 /100 | #157 | Good 98.0% |
| Immigrants | North Macedonia | 65.7 /100 | #158 | Good 98.0% |
| French American Indians | 62.1 /100 | #159 | Good 98.0% |
| Immigrants | Russia | 59.9 /100 | #160 | Average 98.0% |
| Immigrants | Eastern Europe | 59.7 /100 | #161 | Average 98.0% |
| Brazilians | 59.4 /100 | #162 | Average 98.0% |
| Immigrants | Italy | 59.0 /100 | #163 | Average 98.0% |
| Ugandans | 56.4 /100 | #164 | Average 98.0% |
| Chileans | 56.4 /100 | #165 | Average 98.0% |
| Spanish Americans | 55.6 /100 | #166 | Average 98.0% |
| Immigrants | Spain | 55.6 /100 | #167 | Average 98.0% |
| Immigrants | Micronesia | 55.0 /100 | #168 | Average 98.0% |