Macedonian vs Central American Nursery School
COMPARE
Macedonian
Central American
Nursery School
Nursery School Comparison
Macedonians
Central Americans
98.3%
NURSERY SCHOOL
98.7/ 100
METRIC RATING
92nd/ 347
METRIC RANK
96.6%
NURSERY SCHOOL
0.0/ 100
METRIC RATING
333rd/ 347
METRIC RANK
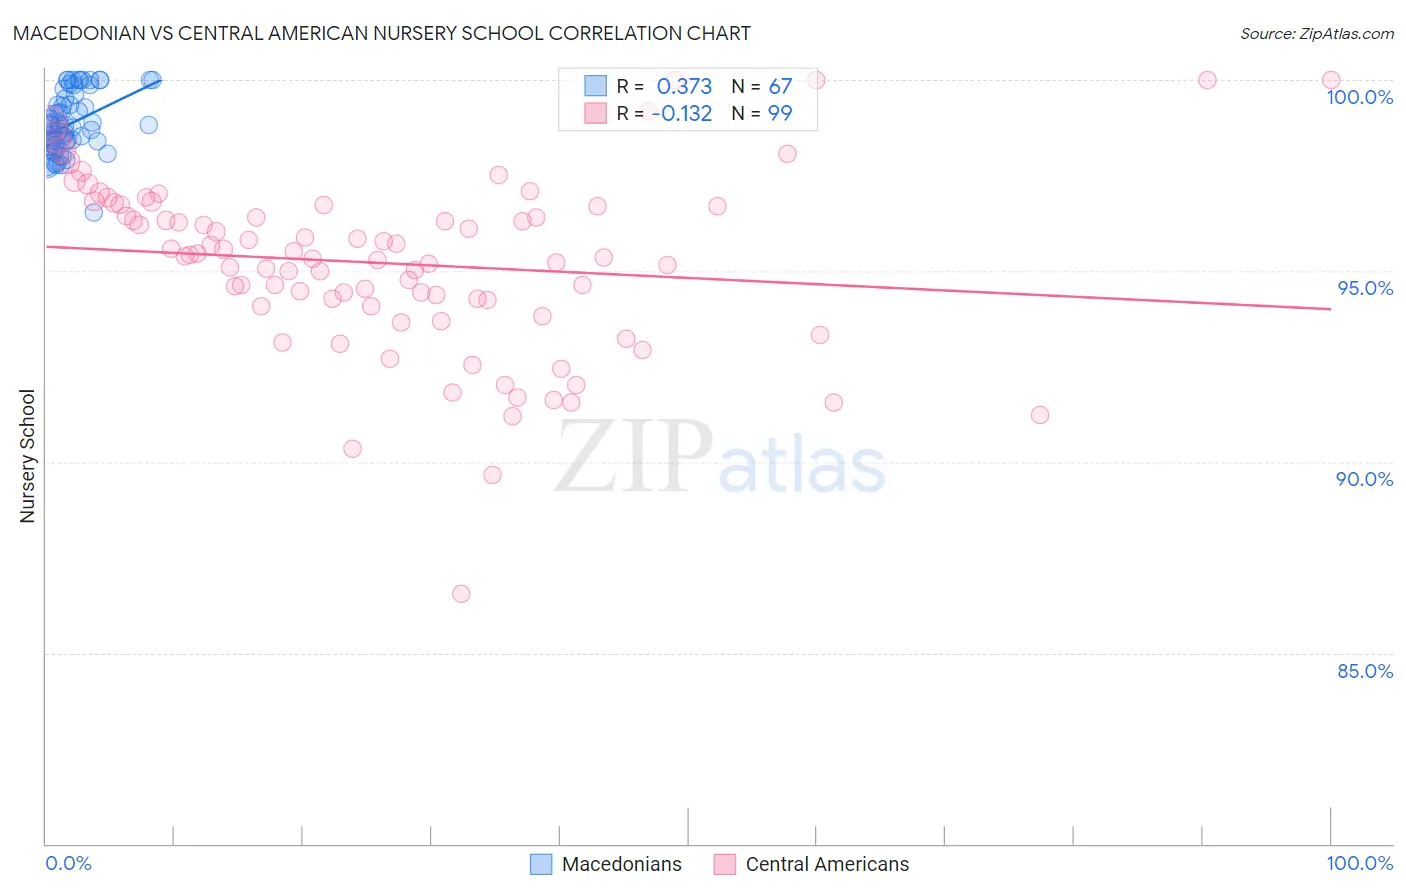
Macedonian vs Central American Nursery School Correlation Chart
The statistical analysis conducted on geographies consisting of 132,590,497 people shows a mild positive correlation between the proportion of Macedonians and percentage of population with at least nursery school education in the United States with a correlation coefficient (R) of 0.373 and weighted average of 98.3%. Similarly, the statistical analysis conducted on geographies consisting of 504,619,275 people shows a poor negative correlation between the proportion of Central Americans and percentage of population with at least nursery school education in the United States with a correlation coefficient (R) of -0.132 and weighted average of 96.6%, a difference of 1.7%.
Nursery School Correlation Summary
| Measurement | Macedonian | Central American |
| Minimum | 96.5% | 86.5% |
| Maximum | 100.0% | 100.0% |
| Range | 3.5% | 13.5% |
| Mean | 98.9% | 95.2% |
| Median | 98.8% | 95.4% |
| Interquartile 25% (IQ1) | 98.3% | 94.1% |
| Interquartile 75% (IQ3) | 99.5% | 96.7% |
| Interquartile Range (IQR) | 1.2% | 2.6% |
| Standard Deviation (Sample) | 0.78% | 2.3% |
| Standard Deviation (Population) | 0.77% | 2.3% |
Similar Demographics by Nursery School
Demographics Similar to Macedonians by Nursery School
In terms of nursery school, the demographic groups most similar to Macedonians are Immigrants from Western Europe (98.3%, a difference of 0.0%), Zimbabwean (98.3%, a difference of 0.0%), Immigrants from India (98.3%, a difference of 0.0%), Hopi (98.3%, a difference of 0.010%), and Ukrainian (98.3%, a difference of 0.010%).
| Demographics | Rating | Rank | Nursery School |
| Immigrants | Sweden | 99.1 /100 | #85 | Exceptional 98.3% |
| Immigrants | Australia | 99.0 /100 | #86 | Exceptional 98.3% |
| Hopi | 98.9 /100 | #87 | Exceptional 98.3% |
| Ukrainians | 98.9 /100 | #88 | Exceptional 98.3% |
| Immigrants | South Africa | 98.8 /100 | #89 | Exceptional 98.3% |
| Immigrants | Western Europe | 98.8 /100 | #90 | Exceptional 98.3% |
| Zimbabweans | 98.8 /100 | #91 | Exceptional 98.3% |
| Macedonians | 98.7 /100 | #92 | Exceptional 98.3% |
| Immigrants | India | 98.7 /100 | #93 | Exceptional 98.3% |
| Immigrants | Germany | 98.6 /100 | #94 | Exceptional 98.3% |
| South Africans | 98.6 /100 | #95 | Exceptional 98.3% |
| Cypriots | 98.3 /100 | #96 | Exceptional 98.3% |
| Immigrants | Nonimmigrants | 98.3 /100 | #97 | Exceptional 98.3% |
| Choctaw | 98.3 /100 | #98 | Exceptional 98.3% |
| Colville | 98.2 /100 | #99 | Exceptional 98.3% |
Demographics Similar to Central Americans by Nursery School
In terms of nursery school, the demographic groups most similar to Central Americans are Immigrants from Dominican Republic (96.6%, a difference of 0.010%), Yakama (96.6%, a difference of 0.020%), Immigrants from Armenia (96.7%, a difference of 0.030%), Bangladeshi (96.6%, a difference of 0.040%), and Immigrants from Vietnam (96.7%, a difference of 0.060%).
| Demographics | Rating | Rank | Nursery School |
| Indonesians | 0.0 /100 | #326 | Tragic 96.8% |
| Mexicans | 0.0 /100 | #327 | Tragic 96.8% |
| Immigrants | Latin America | 0.0 /100 | #328 | Tragic 96.7% |
| Immigrants | Vietnam | 0.0 /100 | #329 | Tragic 96.7% |
| Japanese | 0.0 /100 | #330 | Tragic 96.7% |
| Immigrants | Armenia | 0.0 /100 | #331 | Tragic 96.7% |
| Yakama | 0.0 /100 | #332 | Tragic 96.6% |
| Central Americans | 0.0 /100 | #333 | Tragic 96.6% |
| Immigrants | Dominican Republic | 0.0 /100 | #334 | Tragic 96.6% |
| Bangladeshis | 0.0 /100 | #335 | Tragic 96.6% |
| Guatemalans | 0.0 /100 | #336 | Tragic 96.6% |
| Immigrants | Cambodia | 0.0 /100 | #337 | Tragic 96.5% |
| Immigrants | Fiji | 0.0 /100 | #338 | Tragic 96.5% |
| Immigrants | Guatemala | 0.0 /100 | #339 | Tragic 96.4% |
| Immigrants | Central America | 0.0 /100 | #340 | Tragic 96.4% |