Colombian vs Mexican No Schooling Completed
COMPARE
Colombian
Mexican
No Schooling Completed
No Schooling Completed Comparison
Colombians
Mexicans
2.3%
NO SCHOOLING COMPLETED
3.2/ 100
METRIC RATING
232nd/ 347
METRIC RANK
3.3%
NO SCHOOLING COMPLETED
0.0/ 100
METRIC RATING
328th/ 347
METRIC RANK
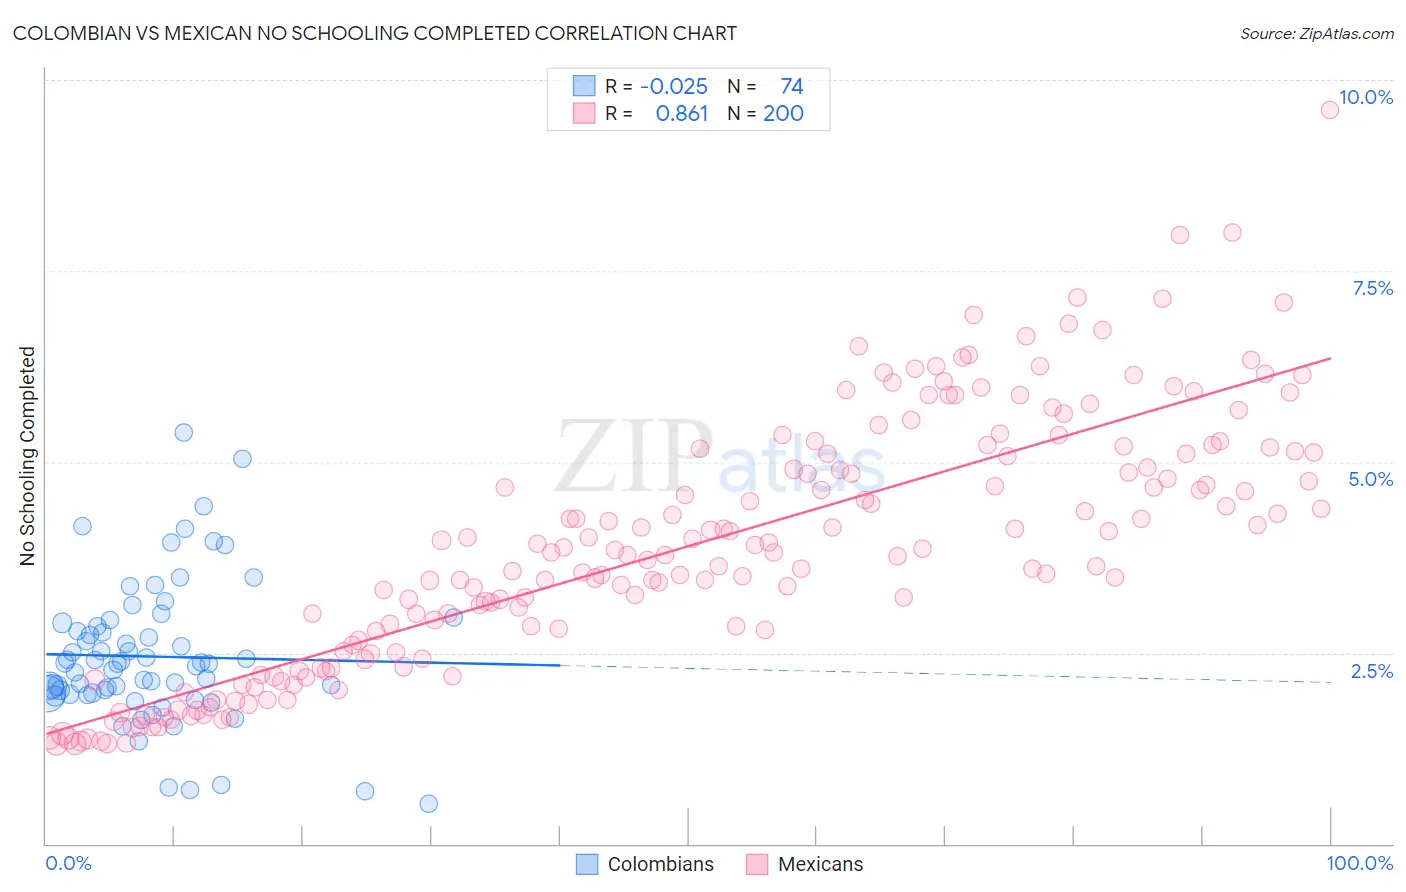
Colombian vs Mexican No Schooling Completed Correlation Chart
The statistical analysis conducted on geographies consisting of 415,449,893 people shows no correlation between the proportion of Colombians and percentage of population with no schooling in the United States with a correlation coefficient (R) of -0.025 and weighted average of 2.3%. Similarly, the statistical analysis conducted on geographies consisting of 549,296,204 people shows a very strong positive correlation between the proportion of Mexicans and percentage of population with no schooling in the United States with a correlation coefficient (R) of 0.861 and weighted average of 3.3%, a difference of 41.4%.
No Schooling Completed Correlation Summary
| Measurement | Colombian | Mexican |
| Minimum | 0.52% | 1.3% |
| Maximum | 5.4% | 9.6% |
| Range | 4.9% | 8.3% |
| Mean | 2.5% | 3.9% |
| Median | 2.4% | 3.8% |
| Interquartile 25% (IQ1) | 2.0% | 2.5% |
| Interquartile 75% (IQ3) | 2.8% | 5.1% |
| Interquartile Range (IQR) | 0.88% | 2.6% |
| Standard Deviation (Sample) | 0.93% | 1.7% |
| Standard Deviation (Population) | 0.92% | 1.6% |
Similar Demographics by No Schooling Completed
Demographics Similar to Colombians by No Schooling Completed
In terms of no schooling completed, the demographic groups most similar to Colombians are Immigrants from Uruguay (2.3%, a difference of 0.22%), Puerto Rican (2.3%, a difference of 0.25%), Immigrants from Malaysia (2.3%, a difference of 0.36%), Immigrants from Pakistan (2.3%, a difference of 0.38%), and U.S. Virgin Islander (2.3%, a difference of 0.47%).
| Demographics | Rating | Rank | No Schooling Completed |
| Sudanese | 4.1 /100 | #225 | Tragic 2.3% |
| Sierra Leoneans | 4.1 /100 | #226 | Tragic 2.3% |
| Immigrants | Uganda | 4.0 /100 | #227 | Tragic 2.3% |
| U.S. Virgin Islanders | 3.7 /100 | #228 | Tragic 2.3% |
| Immigrants | Pakistan | 3.6 /100 | #229 | Tragic 2.3% |
| Puerto Ricans | 3.4 /100 | #230 | Tragic 2.3% |
| Immigrants | Uruguay | 3.4 /100 | #231 | Tragic 2.3% |
| Colombians | 3.2 /100 | #232 | Tragic 2.3% |
| Immigrants | Malaysia | 2.8 /100 | #233 | Tragic 2.3% |
| Nigerians | 2.6 /100 | #234 | Tragic 2.3% |
| Immigrants | Western Asia | 2.6 /100 | #235 | Tragic 2.3% |
| Iraqis | 2.2 /100 | #236 | Tragic 2.4% |
| Immigrants | Eastern Asia | 2.0 /100 | #237 | Tragic 2.4% |
| Paiute | 1.9 /100 | #238 | Tragic 2.4% |
| Liberians | 1.8 /100 | #239 | Tragic 2.4% |
Demographics Similar to Mexicans by No Schooling Completed
In terms of no schooling completed, the demographic groups most similar to Mexicans are Immigrants from Latin America (3.3%, a difference of 0.22%), Immigrants from Vietnam (3.3%, a difference of 1.1%), Immigrants from Armenia (3.3%, a difference of 1.5%), Japanese (3.3%, a difference of 1.5%), and Indonesian (3.2%, a difference of 2.7%).
| Demographics | Rating | Rank | No Schooling Completed |
| Immigrants | Laos | 0.0 /100 | #321 | Tragic 3.1% |
| Immigrants | Honduras | 0.0 /100 | #322 | Tragic 3.2% |
| Vietnamese | 0.0 /100 | #323 | Tragic 3.2% |
| Mexican American Indians | 0.0 /100 | #324 | Tragic 3.2% |
| Dominicans | 0.0 /100 | #325 | Tragic 3.2% |
| Indonesians | 0.0 /100 | #326 | Tragic 3.2% |
| Immigrants | Latin America | 0.0 /100 | #327 | Tragic 3.3% |
| Mexicans | 0.0 /100 | #328 | Tragic 3.3% |
| Immigrants | Vietnam | 0.0 /100 | #329 | Tragic 3.3% |
| Immigrants | Armenia | 0.0 /100 | #330 | Tragic 3.3% |
| Japanese | 0.0 /100 | #331 | Tragic 3.3% |
| Central Americans | 0.0 /100 | #332 | Tragic 3.4% |
| Immigrants | Dominican Republic | 0.0 /100 | #333 | Tragic 3.4% |
| Guatemalans | 0.0 /100 | #334 | Tragic 3.5% |
| Immigrants | Cambodia | 0.0 /100 | #335 | Tragic 3.5% |