Polish vs Mexican No Schooling Completed
COMPARE
Polish
Mexican
No Schooling Completed
No Schooling Completed Comparison
Poles
Mexicans
1.4%
NO SCHOOLING COMPLETED
100.0/ 100
METRIC RATING
13th/ 347
METRIC RANK
3.3%
NO SCHOOLING COMPLETED
0.0/ 100
METRIC RATING
328th/ 347
METRIC RANK
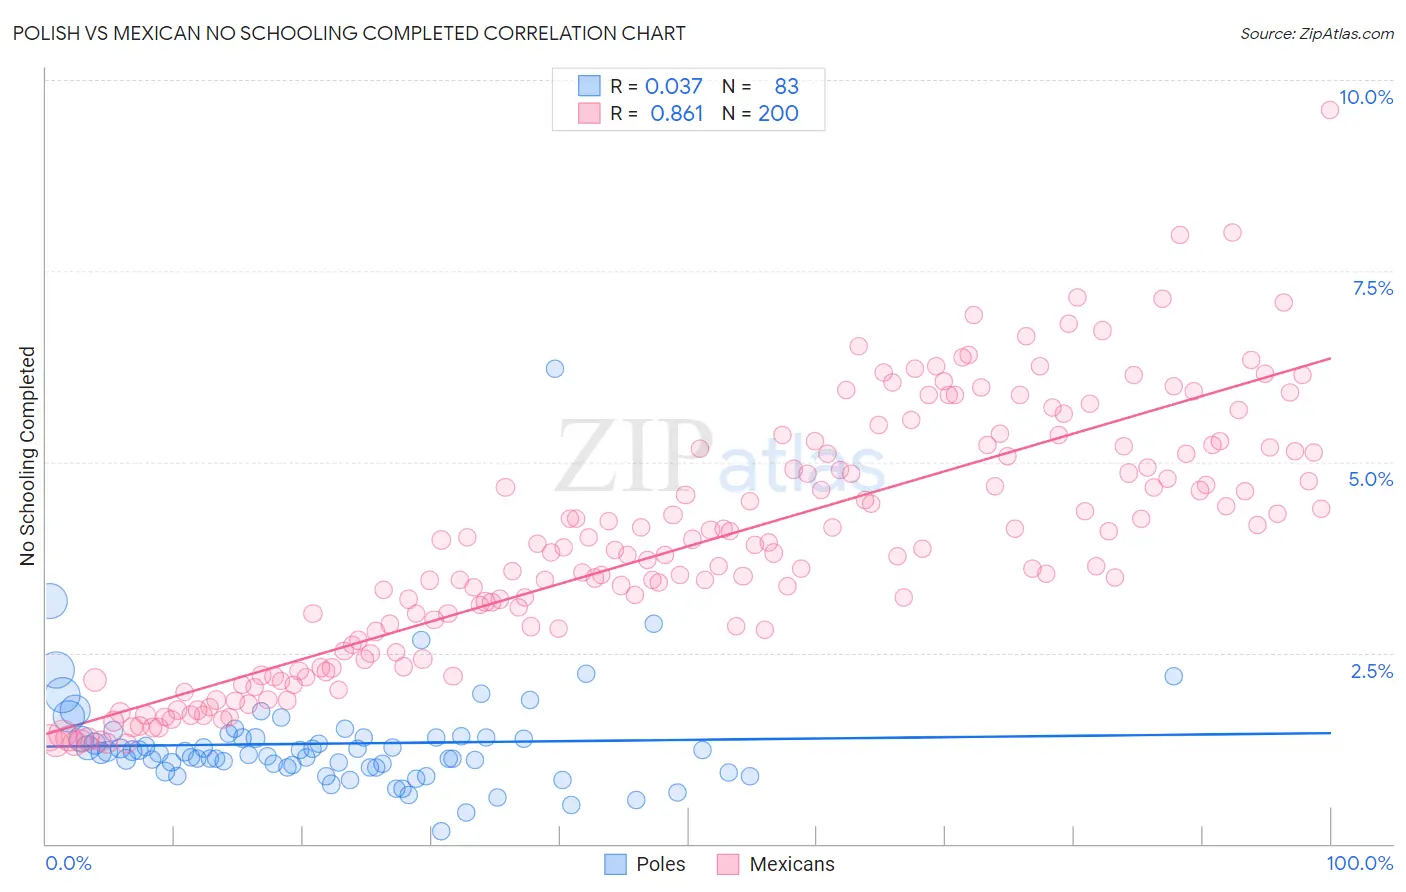
Polish vs Mexican No Schooling Completed Correlation Chart
The statistical analysis conducted on geographies consisting of 543,036,846 people shows no correlation between the proportion of Poles and percentage of population with no schooling in the United States with a correlation coefficient (R) of 0.037 and weighted average of 1.4%. Similarly, the statistical analysis conducted on geographies consisting of 549,296,204 people shows a very strong positive correlation between the proportion of Mexicans and percentage of population with no schooling in the United States with a correlation coefficient (R) of 0.861 and weighted average of 3.3%, a difference of 129.2%.
No Schooling Completed Correlation Summary
| Measurement | Polish | Mexican |
| Minimum | 0.16% | 1.3% |
| Maximum | 6.2% | 9.6% |
| Range | 6.1% | 8.3% |
| Mean | 1.3% | 3.9% |
| Median | 1.2% | 3.8% |
| Interquartile 25% (IQ1) | 1.00% | 2.5% |
| Interquartile 75% (IQ3) | 1.4% | 5.1% |
| Interquartile Range (IQR) | 0.39% | 2.6% |
| Standard Deviation (Sample) | 0.74% | 1.7% |
| Standard Deviation (Population) | 0.74% | 1.6% |
Similar Demographics by No Schooling Completed
Demographics Similar to Poles by No Schooling Completed
In terms of no schooling completed, the demographic groups most similar to Poles are Irish (1.4%, a difference of 0.030%), Lithuanian (1.4%, a difference of 0.050%), Dutch (1.4%, a difference of 0.89%), Scotch-Irish (1.5%, a difference of 0.94%), and Tlingit-Haida (1.5%, a difference of 1.0%).
| Demographics | Rating | Rank | No Schooling Completed |
| Carpatho Rusyns | 100.0 /100 | #6 | Exceptional 1.4% |
| English | 100.0 /100 | #7 | Exceptional 1.4% |
| Swedes | 100.0 /100 | #8 | Exceptional 1.4% |
| Scottish | 100.0 /100 | #9 | Exceptional 1.4% |
| Dutch | 100.0 /100 | #10 | Exceptional 1.4% |
| Lithuanians | 100.0 /100 | #11 | Exceptional 1.4% |
| Irish | 100.0 /100 | #12 | Exceptional 1.4% |
| Poles | 100.0 /100 | #13 | Exceptional 1.4% |
| Scotch-Irish | 100.0 /100 | #14 | Exceptional 1.5% |
| Tlingit-Haida | 100.0 /100 | #15 | Exceptional 1.5% |
| Finns | 100.0 /100 | #16 | Exceptional 1.5% |
| Croatians | 100.0 /100 | #17 | Exceptional 1.5% |
| Danes | 100.0 /100 | #18 | Exceptional 1.5% |
| Alaskan Athabascans | 100.0 /100 | #19 | Exceptional 1.5% |
| Welsh | 100.0 /100 | #20 | Exceptional 1.5% |
Demographics Similar to Mexicans by No Schooling Completed
In terms of no schooling completed, the demographic groups most similar to Mexicans are Immigrants from Latin America (3.3%, a difference of 0.22%), Immigrants from Vietnam (3.3%, a difference of 1.1%), Immigrants from Armenia (3.3%, a difference of 1.5%), Japanese (3.3%, a difference of 1.5%), and Indonesian (3.2%, a difference of 2.7%).
| Demographics | Rating | Rank | No Schooling Completed |
| Immigrants | Laos | 0.0 /100 | #321 | Tragic 3.1% |
| Immigrants | Honduras | 0.0 /100 | #322 | Tragic 3.2% |
| Vietnamese | 0.0 /100 | #323 | Tragic 3.2% |
| Mexican American Indians | 0.0 /100 | #324 | Tragic 3.2% |
| Dominicans | 0.0 /100 | #325 | Tragic 3.2% |
| Indonesians | 0.0 /100 | #326 | Tragic 3.2% |
| Immigrants | Latin America | 0.0 /100 | #327 | Tragic 3.3% |
| Mexicans | 0.0 /100 | #328 | Tragic 3.3% |
| Immigrants | Vietnam | 0.0 /100 | #329 | Tragic 3.3% |
| Immigrants | Armenia | 0.0 /100 | #330 | Tragic 3.3% |
| Japanese | 0.0 /100 | #331 | Tragic 3.3% |
| Central Americans | 0.0 /100 | #332 | Tragic 3.4% |
| Immigrants | Dominican Republic | 0.0 /100 | #333 | Tragic 3.4% |
| Guatemalans | 0.0 /100 | #334 | Tragic 3.5% |
| Immigrants | Cambodia | 0.0 /100 | #335 | Tragic 3.5% |