Lumbee vs Immigrants from Latvia 8th Grade
COMPARE
Lumbee
Immigrants from Latvia
8th Grade
8th Grade Comparison
Lumbee
Immigrants from Latvia
96.0%
8TH GRADE
84.1/ 100
METRIC RATING
145th/ 347
METRIC RANK
96.3%
8TH GRADE
97.8/ 100
METRIC RATING
107th/ 347
METRIC RANK
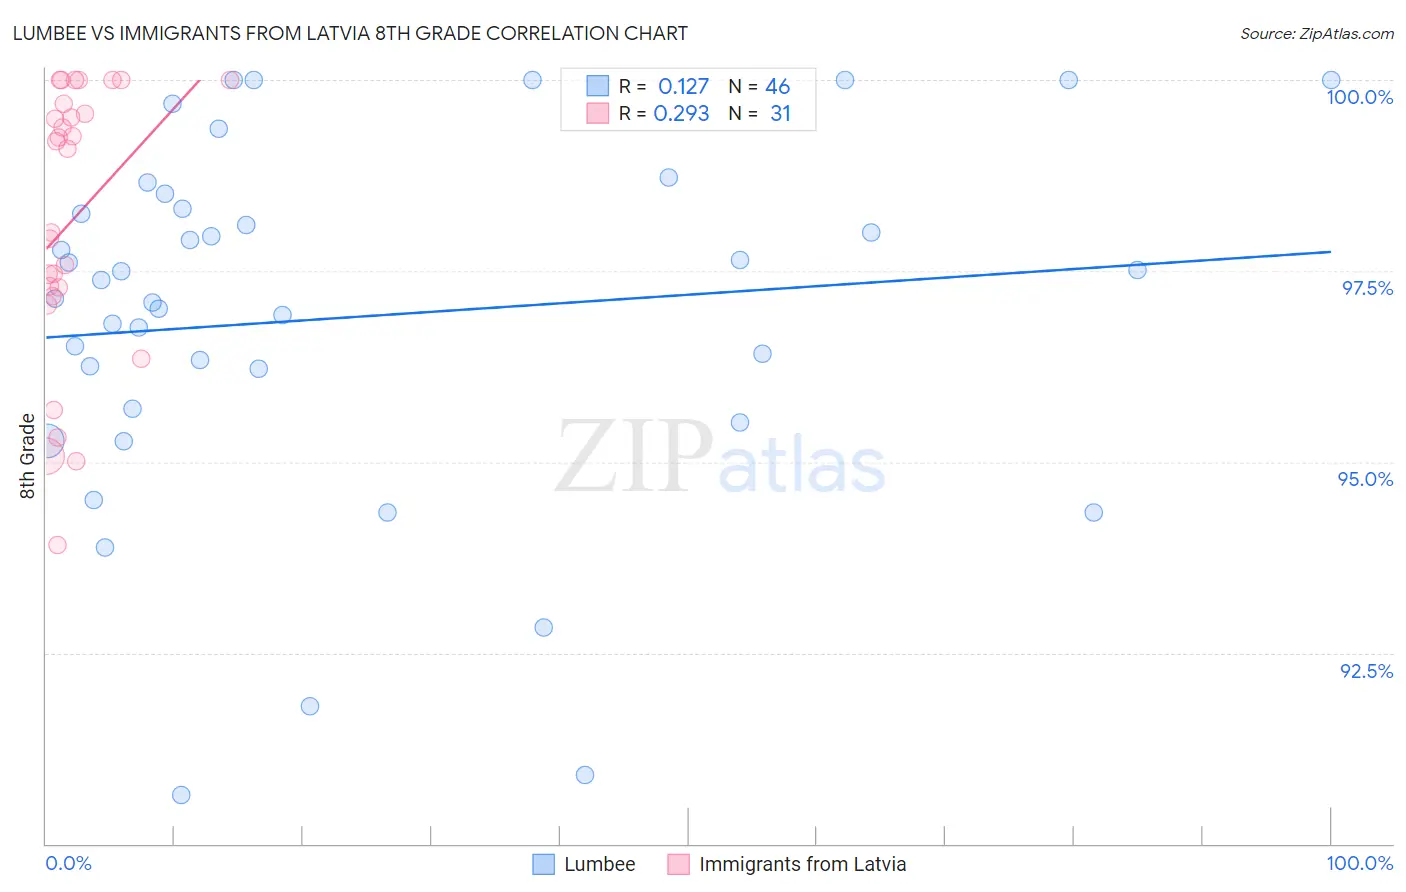
Lumbee vs Immigrants from Latvia 8th Grade Correlation Chart
The statistical analysis conducted on geographies consisting of 92,298,865 people shows a poor positive correlation between the proportion of Lumbee and percentage of population with at least 8th grade education in the United States with a correlation coefficient (R) of 0.127 and weighted average of 96.0%. Similarly, the statistical analysis conducted on geographies consisting of 113,735,345 people shows a weak positive correlation between the proportion of Immigrants from Latvia and percentage of population with at least 8th grade education in the United States with a correlation coefficient (R) of 0.293 and weighted average of 96.3%, a difference of 0.35%.
8th Grade Correlation Summary
| Measurement | Lumbee | Immigrants from Latvia |
| Minimum | 90.6% | 93.9% |
| Maximum | 100.0% | 100.0% |
| Range | 9.4% | 6.1% |
| Mean | 96.9% | 98.2% |
| Median | 97.3% | 99.1% |
| Interquartile 25% (IQ1) | 95.7% | 97.2% |
| Interquartile 75% (IQ3) | 98.3% | 99.7% |
| Interquartile Range (IQR) | 2.6% | 2.5% |
| Standard Deviation (Sample) | 2.3% | 1.8% |
| Standard Deviation (Population) | 2.3% | 1.8% |
Similar Demographics by 8th Grade
Demographics Similar to Lumbee by 8th Grade
In terms of 8th grade, the demographic groups most similar to Lumbee are Israeli (96.0%, a difference of 0.0%), Colville (96.0%, a difference of 0.0%), Spanish (96.0%, a difference of 0.010%), Immigrants from Belarus (96.0%, a difference of 0.010%), and Albanian (96.0%, a difference of 0.010%).
| Demographics | Rating | Rank | 8th Grade |
| Burmese | 90.2 /100 | #138 | Exceptional 96.1% |
| Hmong | 89.7 /100 | #139 | Excellent 96.1% |
| Immigrants | South Central Asia | 89.4 /100 | #140 | Excellent 96.1% |
| Immigrants | Greece | 85.9 /100 | #141 | Excellent 96.0% |
| Immigrants | Eastern Europe | 85.4 /100 | #142 | Excellent 96.0% |
| Spanish | 85.1 /100 | #143 | Excellent 96.0% |
| Immigrants | Belarus | 84.8 /100 | #144 | Excellent 96.0% |
| Lumbee | 84.1 /100 | #145 | Excellent 96.0% |
| Israelis | 84.1 /100 | #146 | Excellent 96.0% |
| Colville | 84.0 /100 | #147 | Excellent 96.0% |
| Albanians | 83.1 /100 | #148 | Excellent 96.0% |
| Immigrants | Israel | 81.3 /100 | #149 | Excellent 96.0% |
| Immigrants | Russia | 80.9 /100 | #150 | Excellent 96.0% |
| Blackfeet | 80.8 /100 | #151 | Excellent 96.0% |
| French American Indians | 80.6 /100 | #152 | Excellent 96.0% |
Demographics Similar to Immigrants from Latvia by 8th Grade
In terms of 8th grade, the demographic groups most similar to Immigrants from Latvia are Immigrants from Saudi Arabia (96.3%, a difference of 0.010%), Kiowa (96.3%, a difference of 0.010%), Immigrants from North Macedonia (96.3%, a difference of 0.010%), Okinawan (96.3%, a difference of 0.010%), and Lebanese (96.3%, a difference of 0.020%).
| Demographics | Rating | Rank | 8th Grade |
| Immigrants | Czechoslovakia | 98.6 /100 | #100 | Exceptional 96.4% |
| Bhutanese | 98.2 /100 | #101 | Exceptional 96.4% |
| South Africans | 98.2 /100 | #102 | Exceptional 96.4% |
| Immigrants | Saudi Arabia | 98.0 /100 | #103 | Exceptional 96.3% |
| Kiowa | 98.0 /100 | #104 | Exceptional 96.3% |
| Immigrants | North Macedonia | 98.0 /100 | #105 | Exceptional 96.3% |
| Okinawans | 98.0 /100 | #106 | Exceptional 96.3% |
| Immigrants | Latvia | 97.8 /100 | #107 | Exceptional 96.3% |
| Lebanese | 97.5 /100 | #108 | Exceptional 96.3% |
| Iroquois | 97.5 /100 | #109 | Exceptional 96.3% |
| Cajuns | 97.1 /100 | #110 | Exceptional 96.3% |
| Shoshone | 96.8 /100 | #111 | Exceptional 96.3% |
| Syrians | 96.7 /100 | #112 | Exceptional 96.3% |
| Immigrants | Zimbabwe | 96.7 /100 | #113 | Exceptional 96.3% |
| Immigrants | Japan | 96.5 /100 | #114 | Exceptional 96.2% |