Cuban vs Immigrants from Ethiopia 11th Grade
COMPARE
Cuban
Immigrants from Ethiopia
11th Grade
11th Grade Comparison
Cubans
Immigrants from Ethiopia
90.2%
11TH GRADE
0.0/ 100
METRIC RATING
292nd/ 347
METRIC RANK
92.1%
11TH GRADE
13.9/ 100
METRIC RATING
213th/ 347
METRIC RANK
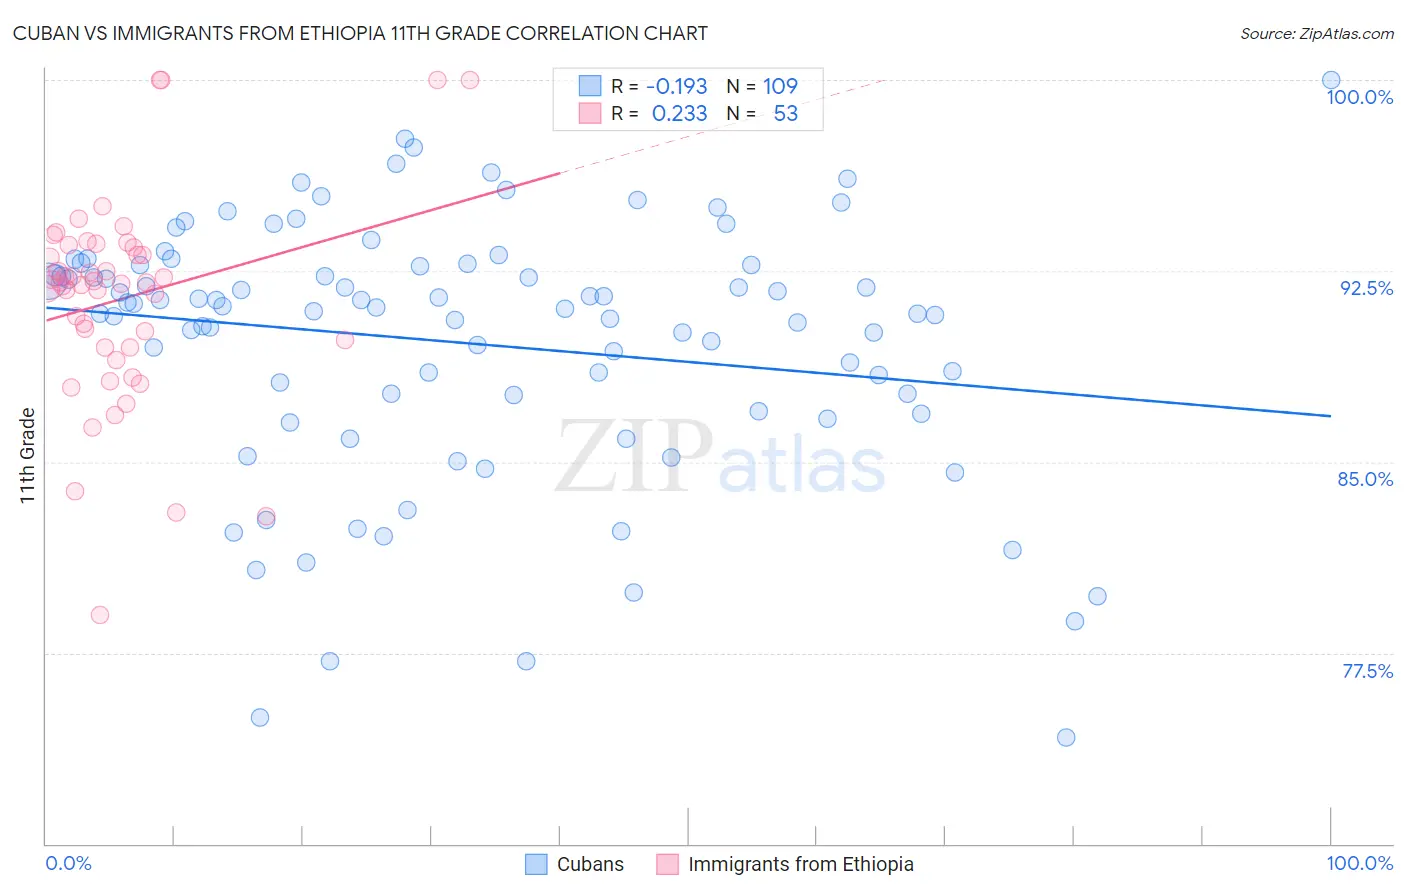
Cuban vs Immigrants from Ethiopia 11th Grade Correlation Chart
The statistical analysis conducted on geographies consisting of 449,369,652 people shows a poor negative correlation between the proportion of Cubans and percentage of population with at least 11th grade education in the United States with a correlation coefficient (R) of -0.193 and weighted average of 90.2%. Similarly, the statistical analysis conducted on geographies consisting of 211,528,629 people shows a weak positive correlation between the proportion of Immigrants from Ethiopia and percentage of population with at least 11th grade education in the United States with a correlation coefficient (R) of 0.233 and weighted average of 92.1%, a difference of 2.1%.
11th Grade Correlation Summary
| Measurement | Cuban | Immigrants from Ethiopia |
| Minimum | 74.2% | 79.0% |
| Maximum | 100.0% | 100.0% |
| Range | 25.8% | 21.0% |
| Mean | 89.7% | 91.4% |
| Median | 91.1% | 92.0% |
| Interquartile 25% (IQ1) | 87.3% | 89.5% |
| Interquartile 75% (IQ3) | 92.7% | 93.5% |
| Interquartile Range (IQR) | 5.4% | 4.0% |
| Standard Deviation (Sample) | 5.1% | 4.1% |
| Standard Deviation (Population) | 5.0% | 4.0% |
Similar Demographics by 11th Grade
Demographics Similar to Cubans by 11th Grade
In terms of 11th grade, the demographic groups most similar to Cubans are Haitian (90.3%, a difference of 0.030%), Indonesian (90.3%, a difference of 0.070%), Native/Alaskan (90.2%, a difference of 0.070%), British West Indian (90.3%, a difference of 0.090%), and Pennsylvania German (90.3%, a difference of 0.11%).
| Demographics | Rating | Rank | 11th Grade |
| Immigrants | Burma/Myanmar | 0.0 /100 | #285 | Tragic 90.4% |
| Immigrants | West Indies | 0.0 /100 | #286 | Tragic 90.4% |
| Apache | 0.0 /100 | #287 | Tragic 90.4% |
| Pennsylvania Germans | 0.0 /100 | #288 | Tragic 90.3% |
| British West Indians | 0.0 /100 | #289 | Tragic 90.3% |
| Indonesians | 0.0 /100 | #290 | Tragic 90.3% |
| Haitians | 0.0 /100 | #291 | Tragic 90.3% |
| Cubans | 0.0 /100 | #292 | Tragic 90.2% |
| Natives/Alaskans | 0.0 /100 | #293 | Tragic 90.2% |
| Immigrants | Grenada | 0.0 /100 | #294 | Tragic 90.1% |
| Immigrants | Vietnam | 0.0 /100 | #295 | Tragic 90.0% |
| Fijians | 0.0 /100 | #296 | Tragic 90.0% |
| Navajo | 0.0 /100 | #297 | Tragic 90.0% |
| Immigrants | Fiji | 0.0 /100 | #298 | Tragic 89.9% |
| Japanese | 0.0 /100 | #299 | Tragic 89.9% |
Demographics Similar to Immigrants from Ethiopia by 11th Grade
In terms of 11th grade, the demographic groups most similar to Immigrants from Ethiopia are Korean (92.1%, a difference of 0.010%), Afghan (92.1%, a difference of 0.020%), Immigrants from Southern Europe (92.1%, a difference of 0.030%), Somali (92.1%, a difference of 0.050%), and Immigrants from Sierra Leone (92.0%, a difference of 0.060%).
| Demographics | Rating | Rank | 11th Grade |
| Bolivians | 23.2 /100 | #206 | Fair 92.2% |
| Immigrants | Oceania | 22.4 /100 | #207 | Fair 92.2% |
| Colville | 21.8 /100 | #208 | Fair 92.2% |
| Tongans | 19.8 /100 | #209 | Poor 92.2% |
| Ethiopians | 18.8 /100 | #210 | Poor 92.2% |
| Immigrants | Micronesia | 17.7 /100 | #211 | Poor 92.2% |
| Koreans | 14.4 /100 | #212 | Poor 92.1% |
| Immigrants | Ethiopia | 13.9 /100 | #213 | Poor 92.1% |
| Afghans | 12.8 /100 | #214 | Poor 92.1% |
| Immigrants | Southern Europe | 12.5 /100 | #215 | Poor 92.1% |
| Somalis | 11.6 /100 | #216 | Poor 92.1% |
| Immigrants | Sierra Leone | 11.1 /100 | #217 | Poor 92.0% |
| Blackfeet | 10.1 /100 | #218 | Poor 92.0% |
| Portuguese | 10.0 /100 | #219 | Tragic 92.0% |
| South American Indians | 7.6 /100 | #220 | Tragic 92.0% |