Immigrants from Africa vs Immigrants from Ethiopia 11th Grade
COMPARE
Immigrants from Africa
Immigrants from Ethiopia
11th Grade
11th Grade Comparison
Immigrants from Africa
Immigrants from Ethiopia
91.9%
11TH GRADE
6.5/ 100
METRIC RATING
222nd/ 347
METRIC RANK
92.1%
11TH GRADE
13.9/ 100
METRIC RATING
213th/ 347
METRIC RANK
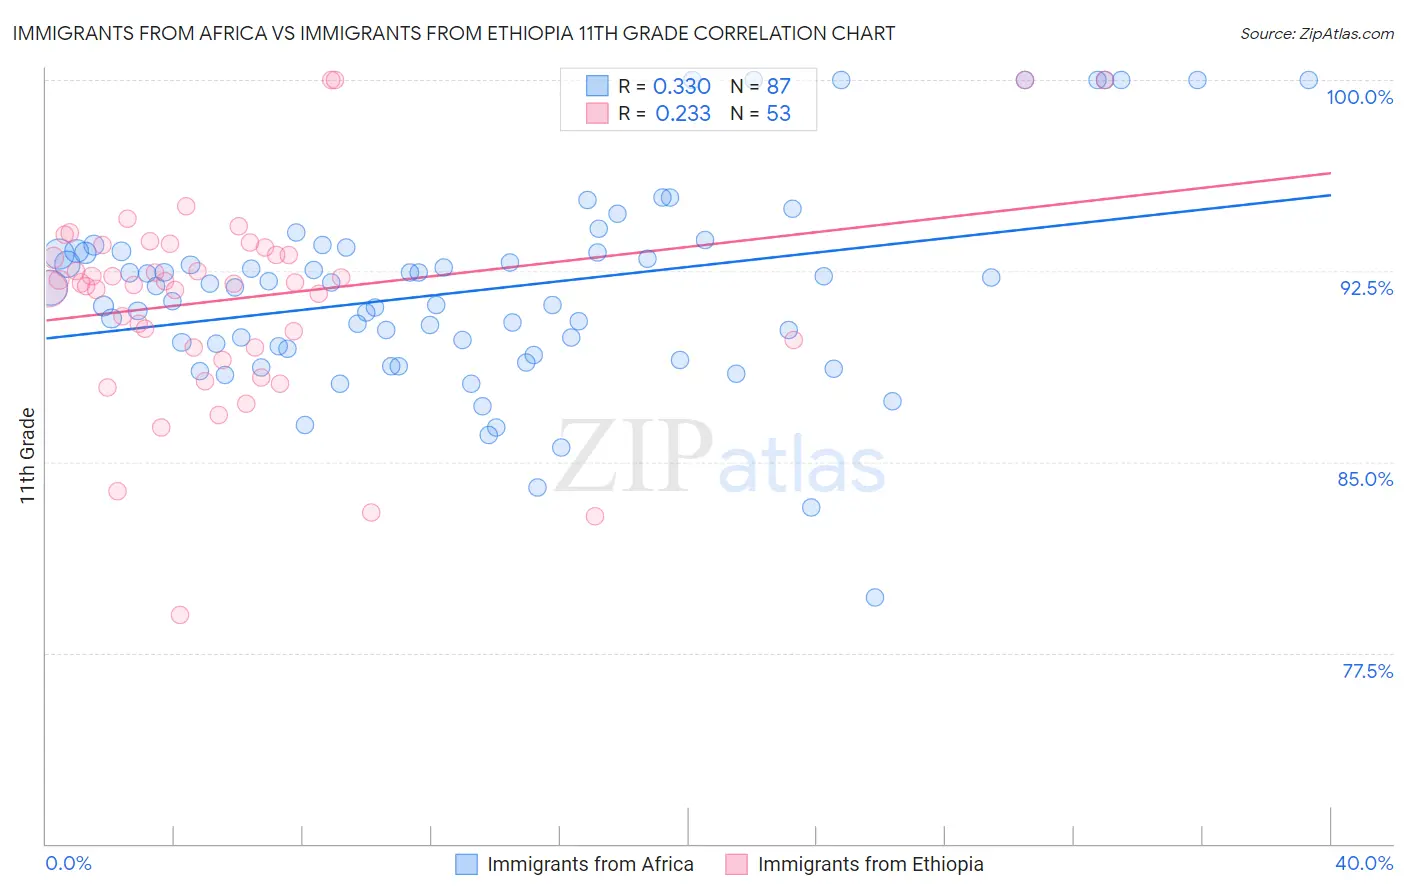
Immigrants from Africa vs Immigrants from Ethiopia 11th Grade Correlation Chart
The statistical analysis conducted on geographies consisting of 469,408,484 people shows a mild positive correlation between the proportion of Immigrants from Africa and percentage of population with at least 11th grade education in the United States with a correlation coefficient (R) of 0.330 and weighted average of 91.9%. Similarly, the statistical analysis conducted on geographies consisting of 211,528,629 people shows a weak positive correlation between the proportion of Immigrants from Ethiopia and percentage of population with at least 11th grade education in the United States with a correlation coefficient (R) of 0.233 and weighted average of 92.1%, a difference of 0.21%.
11th Grade Correlation Summary
| Measurement | Immigrants from Africa | Immigrants from Ethiopia |
| Minimum | 79.7% | 79.0% |
| Maximum | 100.0% | 100.0% |
| Range | 20.3% | 21.0% |
| Mean | 91.7% | 91.4% |
| Median | 91.9% | 92.0% |
| Interquartile 25% (IQ1) | 89.4% | 89.5% |
| Interquartile 75% (IQ3) | 93.3% | 93.5% |
| Interquartile Range (IQR) | 3.8% | 4.0% |
| Standard Deviation (Sample) | 3.9% | 4.1% |
| Standard Deviation (Population) | 3.9% | 4.0% |
Demographics Similar to Immigrants from Africa and Immigrants from Ethiopia by 11th Grade
In terms of 11th grade, the demographic groups most similar to Immigrants from Africa are Immigrants from Bahamas (91.9%, a difference of 0.0%), Costa Rican (91.9%, a difference of 0.010%), Immigrants from Liberia (91.9%, a difference of 0.020%), South American Indian (92.0%, a difference of 0.040%), and Immigrants from Zaire (91.9%, a difference of 0.050%). Similarly, the demographic groups most similar to Immigrants from Ethiopia are Korean (92.1%, a difference of 0.010%), Afghan (92.1%, a difference of 0.020%), Immigrants from Southern Europe (92.1%, a difference of 0.030%), Somali (92.1%, a difference of 0.050%), and Immigrants from Sierra Leone (92.0%, a difference of 0.060%).
| Demographics | Rating | Rank | 11th Grade |
| Immigrants | Oceania | 22.4 /100 | #207 | Fair 92.2% |
| Colville | 21.8 /100 | #208 | Fair 92.2% |
| Tongans | 19.8 /100 | #209 | Poor 92.2% |
| Ethiopians | 18.8 /100 | #210 | Poor 92.2% |
| Immigrants | Micronesia | 17.7 /100 | #211 | Poor 92.2% |
| Koreans | 14.4 /100 | #212 | Poor 92.1% |
| Immigrants | Ethiopia | 13.9 /100 | #213 | Poor 92.1% |
| Afghans | 12.8 /100 | #214 | Poor 92.1% |
| Immigrants | Southern Europe | 12.5 /100 | #215 | Poor 92.1% |
| Somalis | 11.6 /100 | #216 | Poor 92.1% |
| Immigrants | Sierra Leone | 11.1 /100 | #217 | Poor 92.0% |
| Blackfeet | 10.1 /100 | #218 | Poor 92.0% |
| Portuguese | 10.0 /100 | #219 | Tragic 92.0% |
| South American Indians | 7.6 /100 | #220 | Tragic 92.0% |
| Immigrants | Liberia | 7.0 /100 | #221 | Tragic 91.9% |
| Immigrants | Africa | 6.5 /100 | #222 | Tragic 91.9% |
| Immigrants | Bahamas | 6.5 /100 | #223 | Tragic 91.9% |
| Costa Ricans | 6.3 /100 | #224 | Tragic 91.9% |
| Immigrants | Zaire | 5.4 /100 | #225 | Tragic 91.9% |
| Immigrants | Somalia | 5.2 /100 | #226 | Tragic 91.9% |
| Immigrants | Cameroon | 4.4 /100 | #227 | Tragic 91.8% |