Immigrants from Argentina vs Greek 8th Grade
COMPARE
Immigrants from Argentina
Greek
8th Grade
8th Grade Comparison
Immigrants from Argentina
Greeks
95.5%
8TH GRADE
20.6/ 100
METRIC RATING
201st/ 347
METRIC RANK
96.8%
8TH GRADE
99.9/ 100
METRIC RATING
52nd/ 347
METRIC RANK
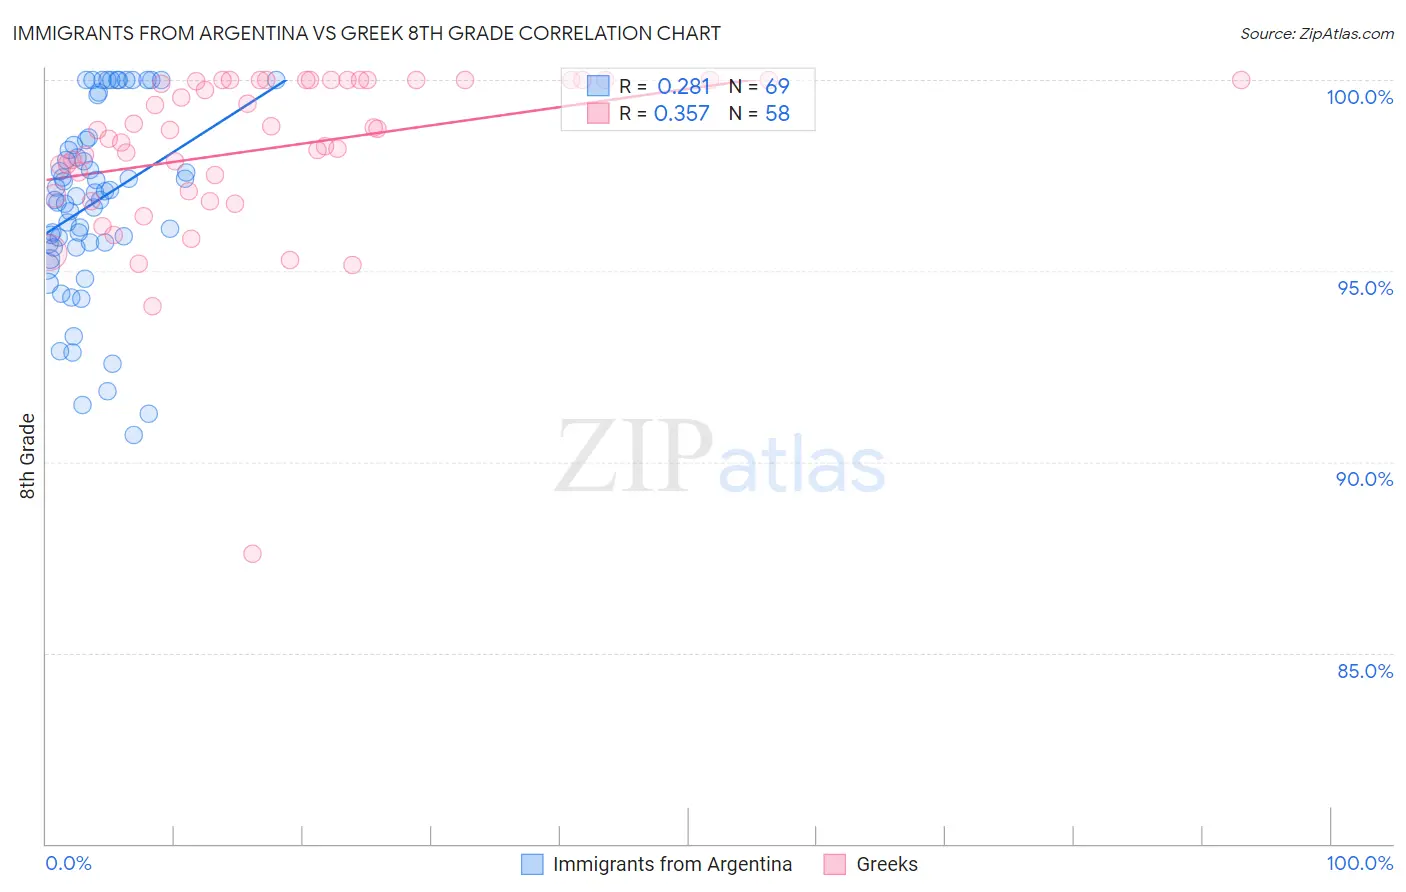
Immigrants from Argentina vs Greek 8th Grade Correlation Chart
The statistical analysis conducted on geographies consisting of 264,437,906 people shows a weak positive correlation between the proportion of Immigrants from Argentina and percentage of population with at least 8th grade education in the United States with a correlation coefficient (R) of 0.281 and weighted average of 95.5%. Similarly, the statistical analysis conducted on geographies consisting of 482,775,358 people shows a mild positive correlation between the proportion of Greeks and percentage of population with at least 8th grade education in the United States with a correlation coefficient (R) of 0.357 and weighted average of 96.8%, a difference of 1.3%.
8th Grade Correlation Summary
| Measurement | Immigrants from Argentina | Greek |
| Minimum | 90.7% | 87.6% |
| Maximum | 100.0% | 100.0% |
| Range | 9.3% | 12.4% |
| Mean | 96.8% | 98.2% |
| Median | 97.0% | 98.7% |
| Interquartile 25% (IQ1) | 95.7% | 97.1% |
| Interquartile 75% (IQ3) | 98.4% | 100.0% |
| Interquartile Range (IQR) | 2.7% | 2.9% |
| Standard Deviation (Sample) | 2.4% | 2.2% |
| Standard Deviation (Population) | 2.4% | 2.1% |
Similar Demographics by 8th Grade
Demographics Similar to Immigrants from Argentina by 8th Grade
In terms of 8th grade, the demographic groups most similar to Immigrants from Argentina are Apache (95.5%, a difference of 0.010%), Paraguayan (95.5%, a difference of 0.020%), Immigrants from Northern Africa (95.5%, a difference of 0.020%), Argentinean (95.5%, a difference of 0.020%), and Sierra Leonean (95.6%, a difference of 0.030%).
| Demographics | Rating | Rank | 8th Grade |
| Guamanians/Chamorros | 26.6 /100 | #194 | Fair 95.6% |
| Immigrants | Zaire | 25.2 /100 | #195 | Fair 95.6% |
| Assyrians/Chaldeans/Syriacs | 24.5 /100 | #196 | Fair 95.6% |
| Sierra Leoneans | 24.3 /100 | #197 | Fair 95.6% |
| Paraguayans | 22.6 /100 | #198 | Fair 95.5% |
| Immigrants | Northern Africa | 22.5 /100 | #199 | Fair 95.5% |
| Argentineans | 22.2 /100 | #200 | Fair 95.5% |
| Immigrants | Argentina | 20.6 /100 | #201 | Fair 95.5% |
| Apache | 19.4 /100 | #202 | Poor 95.5% |
| Moroccans | 17.4 /100 | #203 | Poor 95.5% |
| Hawaiians | 16.7 /100 | #204 | Poor 95.5% |
| Immigrants | Bahamas | 16.7 /100 | #205 | Poor 95.5% |
| Comanche | 16.3 /100 | #206 | Poor 95.5% |
| Immigrants | Sudan | 15.1 /100 | #207 | Poor 95.5% |
| Portuguese | 14.3 /100 | #208 | Poor 95.5% |
Demographics Similar to Greeks by 8th Grade
In terms of 8th grade, the demographic groups most similar to Greeks are Austrian (96.7%, a difference of 0.020%), Serbian (96.7%, a difference of 0.020%), Celtic (96.8%, a difference of 0.030%), Russian (96.7%, a difference of 0.030%), and Australian (96.7%, a difference of 0.030%).
| Demographics | Rating | Rank | 8th Grade |
| Northern Europeans | 99.9 /100 | #45 | Exceptional 96.9% |
| Czechoslovakians | 99.9 /100 | #46 | Exceptional 96.9% |
| Bulgarians | 99.9 /100 | #47 | Exceptional 96.9% |
| Slavs | 99.9 /100 | #48 | Exceptional 96.8% |
| Estonians | 99.9 /100 | #49 | Exceptional 96.8% |
| Immigrants | Scotland | 99.9 /100 | #50 | Exceptional 96.8% |
| Celtics | 99.9 /100 | #51 | Exceptional 96.8% |
| Greeks | 99.9 /100 | #52 | Exceptional 96.8% |
| Austrians | 99.9 /100 | #53 | Exceptional 96.7% |
| Serbians | 99.8 /100 | #54 | Exceptional 96.7% |
| Russians | 99.8 /100 | #55 | Exceptional 96.7% |
| Australians | 99.8 /100 | #56 | Exceptional 96.7% |
| Macedonians | 99.8 /100 | #57 | Exceptional 96.7% |
| Immigrants | Canada | 99.8 /100 | #58 | Exceptional 96.7% |
| Immigrants | North America | 99.8 /100 | #59 | Exceptional 96.7% |