Immigrants from Bosnia and Herzegovina vs Greek 8th Grade
COMPARE
Immigrants from Bosnia and Herzegovina
Greek
8th Grade
8th Grade Comparison
Immigrants from Bosnia and Herzegovina
Greeks
96.2%
8TH GRADE
93.9/ 100
METRIC RATING
128th/ 347
METRIC RANK
96.8%
8TH GRADE
99.9/ 100
METRIC RATING
52nd/ 347
METRIC RANK
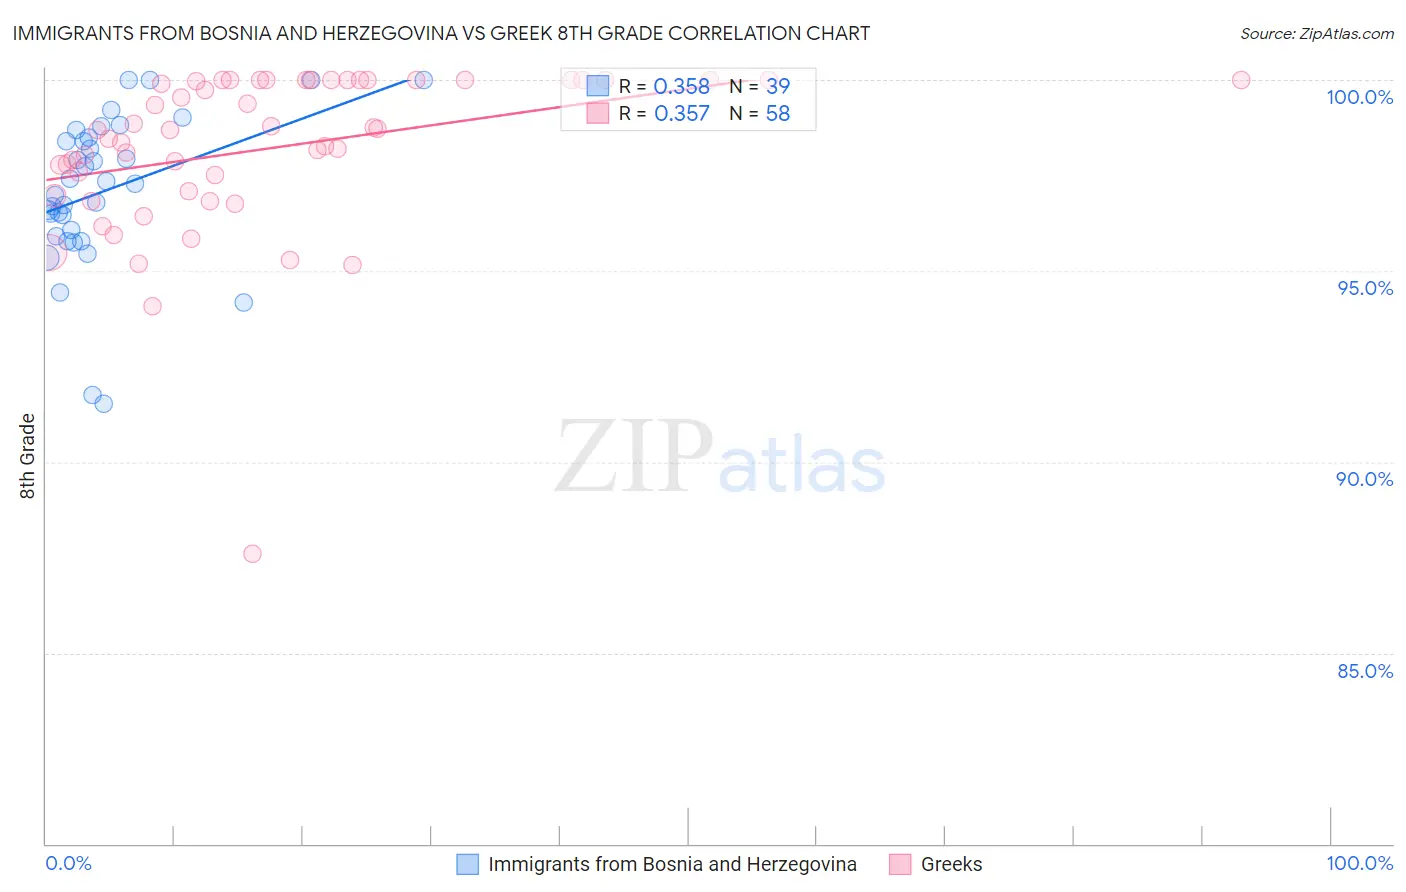
Immigrants from Bosnia and Herzegovina vs Greek 8th Grade Correlation Chart
The statistical analysis conducted on geographies consisting of 156,779,463 people shows a mild positive correlation between the proportion of Immigrants from Bosnia and Herzegovina and percentage of population with at least 8th grade education in the United States with a correlation coefficient (R) of 0.358 and weighted average of 96.2%. Similarly, the statistical analysis conducted on geographies consisting of 482,775,358 people shows a mild positive correlation between the proportion of Greeks and percentage of population with at least 8th grade education in the United States with a correlation coefficient (R) of 0.357 and weighted average of 96.8%, a difference of 0.63%.
8th Grade Correlation Summary
| Measurement | Immigrants from Bosnia and Herzegovina | Greek |
| Minimum | 91.5% | 87.6% |
| Maximum | 100.0% | 100.0% |
| Range | 8.5% | 12.4% |
| Mean | 97.1% | 98.2% |
| Median | 97.3% | 98.7% |
| Interquartile 25% (IQ1) | 95.9% | 97.1% |
| Interquartile 75% (IQ3) | 98.5% | 100.0% |
| Interquartile Range (IQR) | 2.6% | 2.9% |
| Standard Deviation (Sample) | 2.0% | 2.2% |
| Standard Deviation (Population) | 2.0% | 2.1% |
Similar Demographics by 8th Grade
Demographics Similar to Immigrants from Bosnia and Herzegovina by 8th Grade
In terms of 8th grade, the demographic groups most similar to Immigrants from Bosnia and Herzegovina are Choctaw (96.2%, a difference of 0.0%), Immigrants from Serbia (96.2%, a difference of 0.0%), Immigrants from Romania (96.2%, a difference of 0.010%), Cheyenne (96.1%, a difference of 0.010%), and Filipino (96.2%, a difference of 0.020%).
| Demographics | Rating | Rank | 8th Grade |
| Immigrants | Bulgaria | 95.3 /100 | #121 | Exceptional 96.2% |
| Immigrants | Europe | 95.3 /100 | #122 | Exceptional 96.2% |
| Filipinos | 94.6 /100 | #123 | Exceptional 96.2% |
| Palestinians | 94.6 /100 | #124 | Exceptional 96.2% |
| Immigrants | Romania | 94.1 /100 | #125 | Exceptional 96.2% |
| Choctaw | 94.0 /100 | #126 | Exceptional 96.2% |
| Immigrants | Serbia | 94.0 /100 | #127 | Exceptional 96.2% |
| Immigrants | Bosnia and Herzegovina | 93.9 /100 | #128 | Exceptional 96.2% |
| Cheyenne | 93.3 /100 | #129 | Exceptional 96.1% |
| Soviet Union | 92.6 /100 | #130 | Exceptional 96.1% |
| Pueblo | 92.3 /100 | #131 | Exceptional 96.1% |
| Immigrants | Kuwait | 92.2 /100 | #132 | Exceptional 96.1% |
| Immigrants | Turkey | 91.7 /100 | #133 | Exceptional 96.1% |
| Immigrants | Hungary | 91.5 /100 | #134 | Exceptional 96.1% |
| Basques | 91.5 /100 | #135 | Exceptional 96.1% |
Demographics Similar to Greeks by 8th Grade
In terms of 8th grade, the demographic groups most similar to Greeks are Austrian (96.7%, a difference of 0.020%), Serbian (96.7%, a difference of 0.020%), Celtic (96.8%, a difference of 0.030%), Russian (96.7%, a difference of 0.030%), and Australian (96.7%, a difference of 0.030%).
| Demographics | Rating | Rank | 8th Grade |
| Northern Europeans | 99.9 /100 | #45 | Exceptional 96.9% |
| Czechoslovakians | 99.9 /100 | #46 | Exceptional 96.9% |
| Bulgarians | 99.9 /100 | #47 | Exceptional 96.9% |
| Slavs | 99.9 /100 | #48 | Exceptional 96.8% |
| Estonians | 99.9 /100 | #49 | Exceptional 96.8% |
| Immigrants | Scotland | 99.9 /100 | #50 | Exceptional 96.8% |
| Celtics | 99.9 /100 | #51 | Exceptional 96.8% |
| Greeks | 99.9 /100 | #52 | Exceptional 96.8% |
| Austrians | 99.9 /100 | #53 | Exceptional 96.7% |
| Serbians | 99.8 /100 | #54 | Exceptional 96.7% |
| Russians | 99.8 /100 | #55 | Exceptional 96.7% |
| Australians | 99.8 /100 | #56 | Exceptional 96.7% |
| Macedonians | 99.8 /100 | #57 | Exceptional 96.7% |
| Immigrants | Canada | 99.8 /100 | #58 | Exceptional 96.7% |
| Immigrants | North America | 99.8 /100 | #59 | Exceptional 96.7% |