Lithuanian vs Belizean 3rd Grade
COMPARE
Lithuanian
Belizean
3rd Grade
3rd Grade Comparison
Lithuanians
Belizeans
98.5%
3RD GRADE
100.0/ 100
METRIC RATING
21st/ 347
METRIC RANK
96.6%
3RD GRADE
0.0/ 100
METRIC RATING
314th/ 347
METRIC RANK
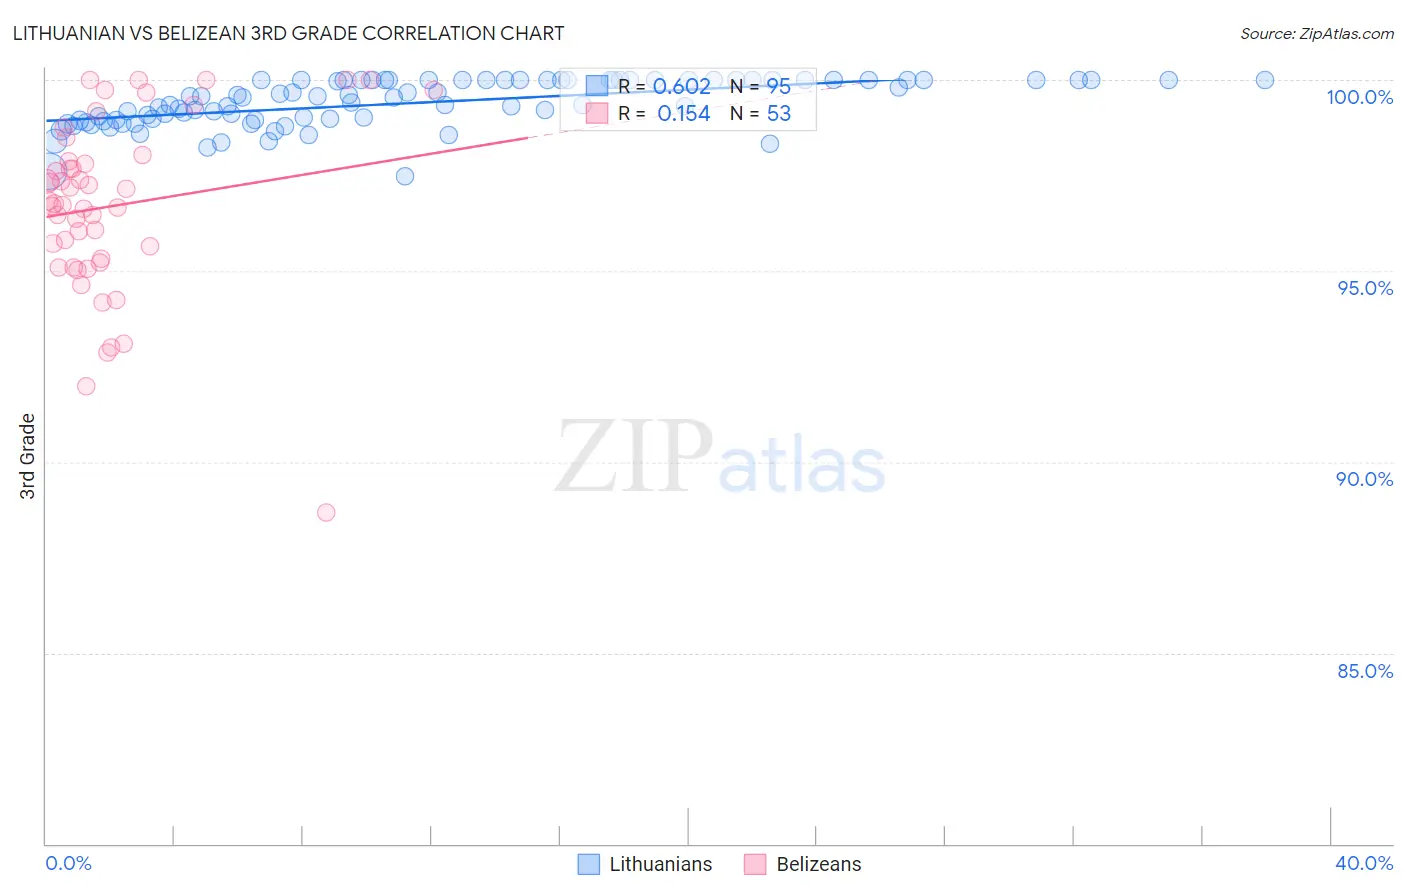
Lithuanian vs Belizean 3rd Grade Correlation Chart
The statistical analysis conducted on geographies consisting of 421,946,231 people shows a significant positive correlation between the proportion of Lithuanians and percentage of population with at least 3rd grade education in the United States with a correlation coefficient (R) of 0.602 and weighted average of 98.5%. Similarly, the statistical analysis conducted on geographies consisting of 144,224,236 people shows a poor positive correlation between the proportion of Belizeans and percentage of population with at least 3rd grade education in the United States with a correlation coefficient (R) of 0.154 and weighted average of 96.6%, a difference of 2.0%.
3rd Grade Correlation Summary
| Measurement | Lithuanian | Belizean |
| Minimum | 97.5% | 88.7% |
| Maximum | 100.0% | 100.0% |
| Range | 2.5% | 11.3% |
| Mean | 99.4% | 96.7% |
| Median | 99.5% | 96.8% |
| Interquartile 25% (IQ1) | 99.0% | 95.3% |
| Interquartile 75% (IQ3) | 100.0% | 98.0% |
| Interquartile Range (IQR) | 1.0% | 2.7% |
| Standard Deviation (Sample) | 0.60% | 2.3% |
| Standard Deviation (Population) | 0.60% | 2.3% |
Similar Demographics by 3rd Grade
Demographics Similar to Lithuanians by 3rd Grade
In terms of 3rd grade, the demographic groups most similar to Lithuanians are Pennsylvania German (98.5%, a difference of 0.0%), Finnish (98.5%, a difference of 0.0%), Sioux (98.5%, a difference of 0.0%), Irish (98.5%, a difference of 0.010%), and Polish (98.5%, a difference of 0.010%).
| Demographics | Rating | Rank | 3rd Grade |
| Carpatho Rusyns | 100.0 /100 | #14 | Exceptional 98.5% |
| Swedes | 100.0 /100 | #15 | Exceptional 98.5% |
| Scottish | 100.0 /100 | #16 | Exceptional 98.5% |
| Dutch | 100.0 /100 | #17 | Exceptional 98.5% |
| Irish | 100.0 /100 | #18 | Exceptional 98.5% |
| Poles | 100.0 /100 | #19 | Exceptional 98.5% |
| Pennsylvania Germans | 100.0 /100 | #20 | Exceptional 98.5% |
| Lithuanians | 100.0 /100 | #21 | Exceptional 98.5% |
| Finns | 100.0 /100 | #22 | Exceptional 98.5% |
| Sioux | 100.0 /100 | #23 | Exceptional 98.5% |
| Danes | 100.0 /100 | #24 | Exceptional 98.5% |
| Scotch-Irish | 100.0 /100 | #25 | Exceptional 98.5% |
| Aleuts | 100.0 /100 | #26 | Exceptional 98.5% |
| Croatians | 100.0 /100 | #27 | Exceptional 98.5% |
| French | 100.0 /100 | #28 | Exceptional 98.4% |
Demographics Similar to Belizeans by 3rd Grade
In terms of 3rd grade, the demographic groups most similar to Belizeans are Immigrants from Ecuador (96.6%, a difference of 0.0%), Immigrants from Laos (96.6%, a difference of 0.010%), Immigrants from the Azores (96.6%, a difference of 0.010%), Immigrants from Burma/Myanmar (96.6%, a difference of 0.020%), and Immigrants from Guyana (96.6%, a difference of 0.030%).
| Demographics | Rating | Rank | 3rd Grade |
| Nicaraguans | 0.0 /100 | #307 | Tragic 96.7% |
| Immigrants | Haiti | 0.0 /100 | #308 | Tragic 96.7% |
| Sri Lankans | 0.0 /100 | #309 | Tragic 96.7% |
| Cape Verdeans | 0.0 /100 | #310 | Tragic 96.6% |
| Immigrants | Guyana | 0.0 /100 | #311 | Tragic 96.6% |
| Immigrants | Laos | 0.0 /100 | #312 | Tragic 96.6% |
| Immigrants | Ecuador | 0.0 /100 | #313 | Tragic 96.6% |
| Belizeans | 0.0 /100 | #314 | Tragic 96.6% |
| Immigrants | Azores | 0.0 /100 | #315 | Tragic 96.6% |
| Immigrants | Burma/Myanmar | 0.0 /100 | #316 | Tragic 96.6% |
| Immigrants | Bangladesh | 0.0 /100 | #317 | Tragic 96.6% |
| Hispanics or Latinos | 0.0 /100 | #318 | Tragic 96.5% |
| Vietnamese | 0.0 /100 | #319 | Tragic 96.5% |
| Immigrants | Nicaragua | 0.0 /100 | #320 | Tragic 96.5% |
| Indonesians | 0.0 /100 | #321 | Tragic 96.5% |