Immigrants from Eastern Europe vs Pima 11th Grade

COMPARE

Immigrants from Eastern Europe
Race
Ancestry
AfghanAfricanAlaska NativeAlaskan AthabascanAlbanianAleutAlsatianAmericanApacheArabArapahoArgentineanArmenianAssyrian/Chaldean/SyriacAustralianAustrianBahamianBangladeshiBarbadianBasqueBelgianBelizeanBermudanBhutaneseBlackfeetBolivianBrazilianBritishBritish West IndianBulgarianBurmeseCajunCambodianCanadianCape VerdeanCarpatho RusynCelticCentral AmericanCentral American IndianCherokeeCheyenneChickasawChileanChineseChippewaChoctawColombianColvilleComancheCosta RicanCreeCreekCroatianCrowCubanCypriotCzechCzechoslovakianDanishDelawareDominicanDutchDutch West IndianEastern EuropeanEcuadorianEgyptianEnglishEstonianEthiopianEuropeanFijianFilipinoFinnishFrenchFrench American IndianFrench CanadianGermanGerman RussianGhanaianGreekGuamanian/ChamorroGuatemalanGuyaneseHaitianHmongHonduranHopiHoumaHungarianIcelanderIndian (Asian)IndonesianInupiatIranianIraqiIrishIroquoisIsraeliItalianJamaicanJapaneseJordanianKenyanKiowaKoreanLaotianLatvianLebaneseLiberianLithuanianLumbeeLuxembourgerMacedonianMalaysianMalteseMarshalleseMenomineeMexicanMexican American IndianMongolianMoroccanNative HawaiianNavajoNepaleseNew ZealanderNicaraguanNigerianNorthern EuropeanNorwegianOkinawanOsageOttawaPaiutePakistaniPalestinianPanamanianParaguayanPennsylvania GermanPeruvianPolishPortuguesePotawatomiPuebloPuerto RicanPuget Sound SalishRomanianRussianSalvadoranSamoanScandinavianScotch-IrishScottishSeminoleSenegaleseSerbianShoshoneSierra LeoneanSiouxSlavicSlovakSloveneSomaliSouth AfricanSouth AmericanSouth American IndianSoviet UnionSpaniardSpanishSpanish AmericanSpanish American IndianSri LankanSubsaharan AfricanSudaneseSwedishSwissSyrianTaiwaneseThaiTlingit-HaidaTohono O'OdhamTonganTrinidadian and TobagonianTsimshianTurkishU.S. Virgin IslanderUgandanUkrainianUruguayanUteVenezuelanVietnameseWelshWest IndianYakamaYaquiYugoslavianYumanYup'ikZimbabwean
Immigration
NonimmigrantsImmigrantsAfghanistanAfricaAlbaniaArgentinaArmeniaAsiaAustraliaAustriaBahamasBangladeshBarbadosBelarusBelgiumBelizeBoliviaBosnia and HerzegovinaBrazilBulgariaBurma/MyanmarCabo VerdeCambodiaCameroonCanadaCaribbeanCentral AmericaChileChinaColombiaCongoCosta RicaCroatiaCubaCzechoslovakiaDenmarkDominicaDominican RepublicEastern AfricaEastern AsiaEastern EuropeEcuadorEgyptEl SalvadorEnglandEritreaEthiopiaEuropeFijiFranceGermanyGhanaGreeceGrenadaGuatemalaGuyanaHaitiHondurasHong KongHungaryIndiaIndonesiaIranIraqIrelandIsraelItalyJamaicaJapanJordanKazakhstanKenyaKoreaKuwaitLaosLatin AmericaLatviaLebanonLiberiaLithuaniaMalaysiaMexicoMicronesiaMiddle AfricaMoldovaMoroccoNepalNetherlandsNicaraguaNigeriaNorth AmericaNorth MacedoniaNorthern AfricaNorthern EuropeNorwayOceaniaPakistanPanamaPeruPhilippinesPolandPortugalRomaniaRussiaSaudi ArabiaScotlandSenegalSerbiaSierra LeoneSingaporeSomaliaSouth AfricaSouth AmericaSouth Central AsiaSouth Eastern AsiaSouthern EuropeSpainSri LankaSt. Vincent and the GrenadinesSudanSwedenSwitzerlandSyriaTaiwanThailandTrinidad and TobagoTurkeyUgandaUkraineUruguayUzbekistanVenezuelaVietnamWest IndiesWestern AfricaWestern AsiaWestern EuropeYemenZaireZimbabweAzores
Pima
Race
Ancestry
AfghanAfricanAlaska NativeAlaskan AthabascanAlbanianAleutAlsatianAmericanApacheArabArapahoArgentineanArmenianAssyrian/Chaldean/SyriacAustralianAustrianBahamianBangladeshiBarbadianBasqueBelgianBelizeanBermudanBhutaneseBlackfeetBolivianBrazilianBritishBritish West IndianBulgarianBurmeseCajunCambodianCanadianCape VerdeanCarpatho RusynCelticCentral AmericanCentral American IndianCherokeeCheyenneChickasawChileanChineseChippewaChoctawColombianColvilleComancheCosta RicanCreeCreekCroatianCrowCubanCypriotCzechCzechoslovakianDanishDelawareDominicanDutchDutch West IndianEastern EuropeanEcuadorianEgyptianEnglishEstonianEthiopianEuropeanFijianFilipinoFinnishFrenchFrench American IndianFrench CanadianGermanGerman RussianGhanaianGreekGuamanian/ChamorroGuatemalanGuyaneseHaitianHmongHonduranHopiHoumaHungarianIcelanderIndian (Asian)IndonesianInupiatIranianIraqiIrishIroquoisIsraeliItalianJamaicanJapaneseJordanianKenyanKiowaKoreanLaotianLatvianLebaneseLiberianLithuanianLumbeeLuxembourgerMacedonianMalaysianMalteseMarshalleseMenomineeMexicanMexican American IndianMongolianMoroccanNative HawaiianNavajoNepaleseNew ZealanderNicaraguanNigerianNorthern EuropeanNorwegianOkinawanOsageOttawaPaiutePakistaniPalestinianPanamanianParaguayanPennsylvania GermanPeruvianPimaPolishPortuguesePotawatomiPuebloPuerto RicanPuget Sound SalishRomanianRussianSalvadoranSamoanScandinavianScotch-IrishScottishSeminoleSenegaleseSerbianShoshoneSierra LeoneanSiouxSlavicSlovakSloveneSomaliSouth AfricanSouth AmericanSouth American IndianSoviet UnionSpaniardSpanishSpanish AmericanSpanish American IndianSri LankanSubsaharan AfricanSudaneseSwedishSwissSyrianTaiwaneseThaiTlingit-HaidaTohono O'OdhamTonganTrinidadian and TobagonianTsimshianTurkishU.S. Virgin IslanderUgandanUkrainianUruguayanUteVenezuelanVietnameseWelshWest IndianYakamaYaquiYugoslavianYumanYup'ikZimbabwean
Immigration
NonimmigrantsImmigrantsAfghanistanAfricaAlbaniaArgentinaArmeniaAsiaAustraliaAustriaBahamasBangladeshBarbadosBelarusBelgiumBelizeBoliviaBosnia and HerzegovinaBrazilBulgariaBurma/MyanmarCabo VerdeCambodiaCameroonCanadaCaribbeanCentral AmericaChileChinaColombiaCongoCosta RicaCroatiaCubaCzechoslovakiaDenmarkDominicaDominican RepublicEastern AfricaEastern AsiaEcuadorEgyptEl SalvadorEnglandEritreaEthiopiaEuropeFijiFranceGermanyGhanaGreeceGrenadaGuatemalaGuyanaHaitiHondurasHong KongHungaryIndiaIndonesiaIranIraqIrelandIsraelItalyJamaicaJapanJordanKazakhstanKenyaKoreaKuwaitLaosLatin AmericaLatviaLebanonLiberiaLithuaniaMalaysiaMexicoMicronesiaMiddle AfricaMoldovaMoroccoNepalNetherlandsNicaraguaNigeriaNorth AmericaNorth MacedoniaNorthern AfricaNorthern EuropeNorwayOceaniaPakistanPanamaPeruPhilippinesPolandPortugalRomaniaRussiaSaudi ArabiaScotlandSenegalSerbiaSierra LeoneSingaporeSomaliaSouth AfricaSouth AmericaSouth Central AsiaSouth Eastern AsiaSouthern EuropeSpainSri LankaSt. Vincent and the GrenadinesSudanSwedenSwitzerlandSyriaTaiwanThailandTrinidad and TobagoTurkeyUgandaUkraineUruguayUzbekistanVenezuelaVietnamWest IndiesWestern AfricaWestern AsiaWestern EuropeYemenZaireZimbabweAzores
11th Grade
Income
Poverty
Unemployment
Labor Participation
Family Structure
Vehicle Availability
Education Level
Disability

11th Grade Comparison

Immigrants from Eastern Europe

Pima

Exceptional
Tragic
93.2%
11TH GRADE
95.9/ 100
METRIC RATING
124th/ 347
METRIC RANK
88.3%
11TH GRADE
0.0/ 100
METRIC RATING
323rd/ 347
METRIC RANK

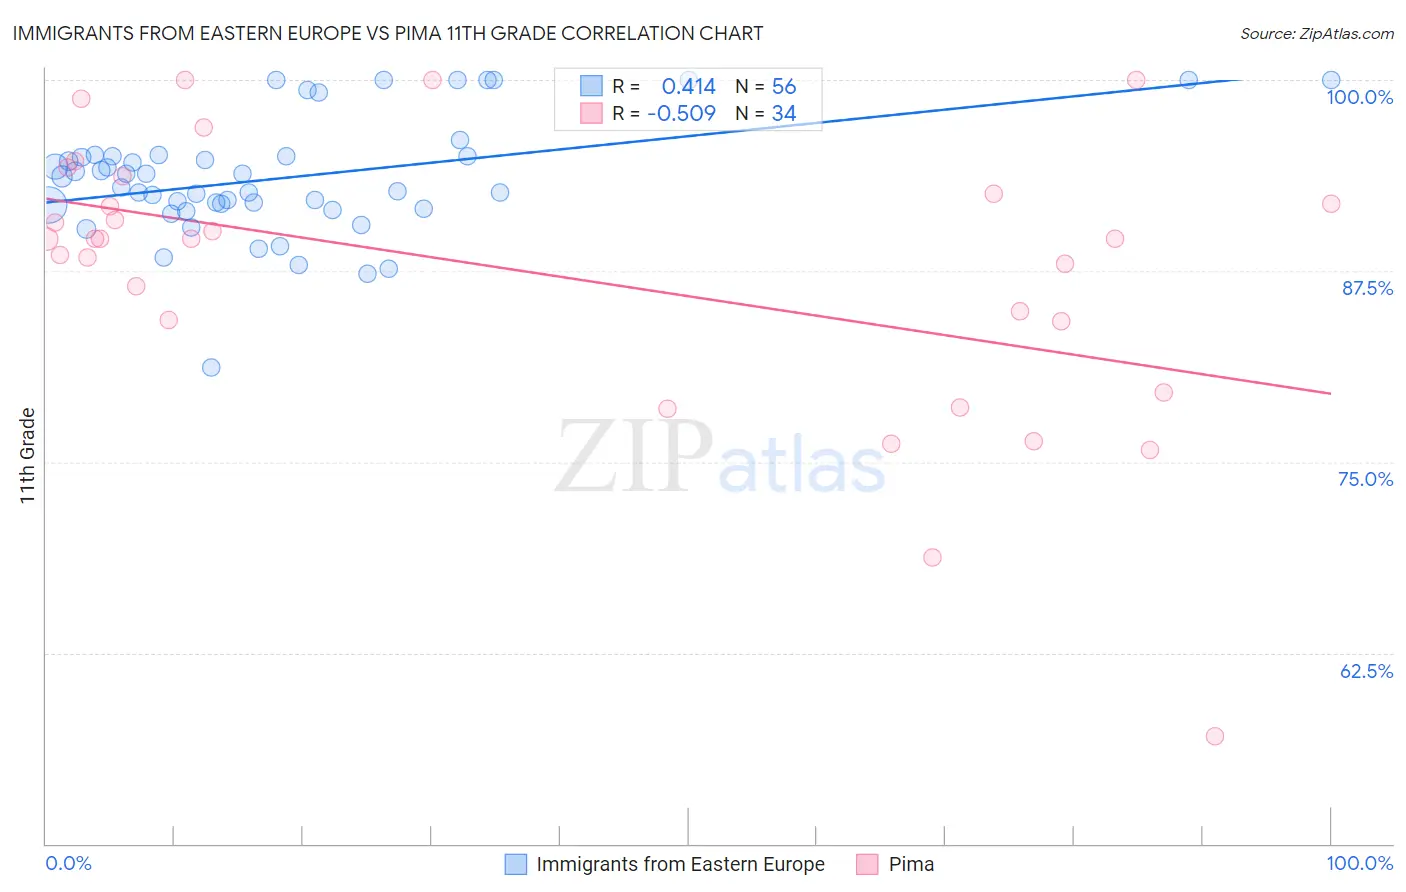
Immigrants from Eastern Europe vs Pima 11th Grade Correlation Chart

The statistical analysis conducted on geographies consisting of 475,879,420 people shows a moderate positive correlation between the proportion of Immigrants from Eastern Europe and percentage of population with at least 11th grade education in the United States with a correlation coefficient (R) of 0.414 and weighted average of 93.2%. Similarly, the statistical analysis conducted on geographies consisting of 61,552,942 people shows a substantial negative correlation between the proportion of Pima and percentage of population with at least 11th grade education in the United States with a correlation coefficient (R) of -0.509 and weighted average of 88.3%, a difference of 5.6%.
Immigrants from Eastern Europe vs Pima 11th Grade

11th Grade Correlation Summary

MeasurementImmigrants from Eastern EuropePima
Minimum81.2%57.0%
Maximum100.0%100.0%
Range18.8%43.0%
Mean93.6%87.3%
Median93.3%89.6%
Interquartile 25% (IQ1)91.7%84.2%
Interquartile 75% (IQ3)95.0%92.6%
Interquartile Range (IQR)3.4%8.4%
Standard Deviation (Sample)3.9%9.3%
Standard Deviation (Population)3.8%9.2%

Similar Demographics by 11th Grade

Demographics Similar to Immigrants from Eastern Europe by 11th Grade

In terms of 11th grade, the demographic groups most similar to Immigrants from Eastern Europe are Immigrants from Greece (93.2%, a difference of 0.0%), Immigrants from Sri Lanka (93.2%, a difference of 0.020%), German Russian (93.3%, a difference of 0.030%), Immigrants from Belarus (93.3%, a difference of 0.030%), and Basque (93.2%, a difference of 0.040%).
DemographicsRating | Rank11th Grade
Whites/Caucasians
97.4
/100
|
#117
Exceptional
93.3%
Immigrants | Korea
97.0
/100
|
#118
Exceptional
93.3%
Israelis
97.0
/100
|
#119
Exceptional
93.3%
Immigrants | Russia
96.6
/100
|
#120
Exceptional
93.3%
German Russians
96.4
/100
|
#121
Exceptional
93.3%
Immigrants | Belarus
96.3
/100
|
#122
Exceptional
93.3%
Immigrants | Greece
95.9
/100
|
#123
Exceptional
93.2%
Immigrants | Eastern Europe
95.9
/100
|
#124
Exceptional
93.2%
Immigrants | Sri Lanka
95.6
/100
|
#125
Exceptional
93.2%
Basques
95.2
/100
|
#126
Exceptional
93.2%
Immigrants | Kazakhstan
92.4
/100
|
#127
Exceptional
93.1%
Immigrants | Jordan
92.4
/100
|
#128
Exceptional
93.1%
Immigrants | Ukraine
89.8
/100
|
#129
Excellent
93.0%
Albanians
89.5
/100
|
#130
Excellent
93.0%
Egyptians
89.5
/100
|
#131
Excellent
93.0%

Demographics Similar to Pima by 11th Grade

In terms of 11th grade, the demographic groups most similar to Pima are Central American Indian (88.2%, a difference of 0.040%), Puerto Rican (88.4%, a difference of 0.080%), Immigrants from Nicaragua (88.1%, a difference of 0.17%), Immigrants from Belize (88.7%, a difference of 0.47%), and Immigrants from Armenia (88.8%, a difference of 0.55%).
DemographicsRating | Rank11th Grade
Immigrants | Cuba
0.0
/100
|
#316
Tragic
88.9%
Lumbee
0.0
/100
|
#317
Tragic
88.9%
Nicaraguans
0.0
/100
|
#318
Tragic
88.9%
Belizeans
0.0
/100
|
#319
Tragic
88.8%
Immigrants | Armenia
0.0
/100
|
#320
Tragic
88.8%
Immigrants | Belize
0.0
/100
|
#321
Tragic
88.7%
Puerto Ricans
0.0
/100
|
#322
Tragic
88.4%
Pima
0.0
/100
|
#323
Tragic
88.3%
Central American Indians
0.0
/100
|
#324
Tragic
88.2%
Immigrants | Nicaragua
0.0
/100
|
#325
Tragic
88.1%
Dominicans
0.0
/100
|
#326
Tragic
87.7%
Immigrants | Cabo Verde
0.0
/100
|
#327
Tragic
87.6%
Tohono O'odham
0.0
/100
|
#328
Tragic
87.6%
Mexican American Indians
0.0
/100
|
#329
Tragic
87.5%
Hondurans
0.0
/100
|
#330
Tragic
87.4%