Immigrants from Western Europe vs Immigrants from South Africa 11th Grade
COMPARE
Immigrants from Western Europe
Immigrants from South Africa
11th Grade
11th Grade Comparison
Immigrants from Western Europe
Immigrants from South Africa
93.6%
11TH GRADE
99.2/ 100
METRIC RATING
87th/ 347
METRIC RANK
93.8%
11TH GRADE
99.7/ 100
METRIC RATING
71st/ 347
METRIC RANK
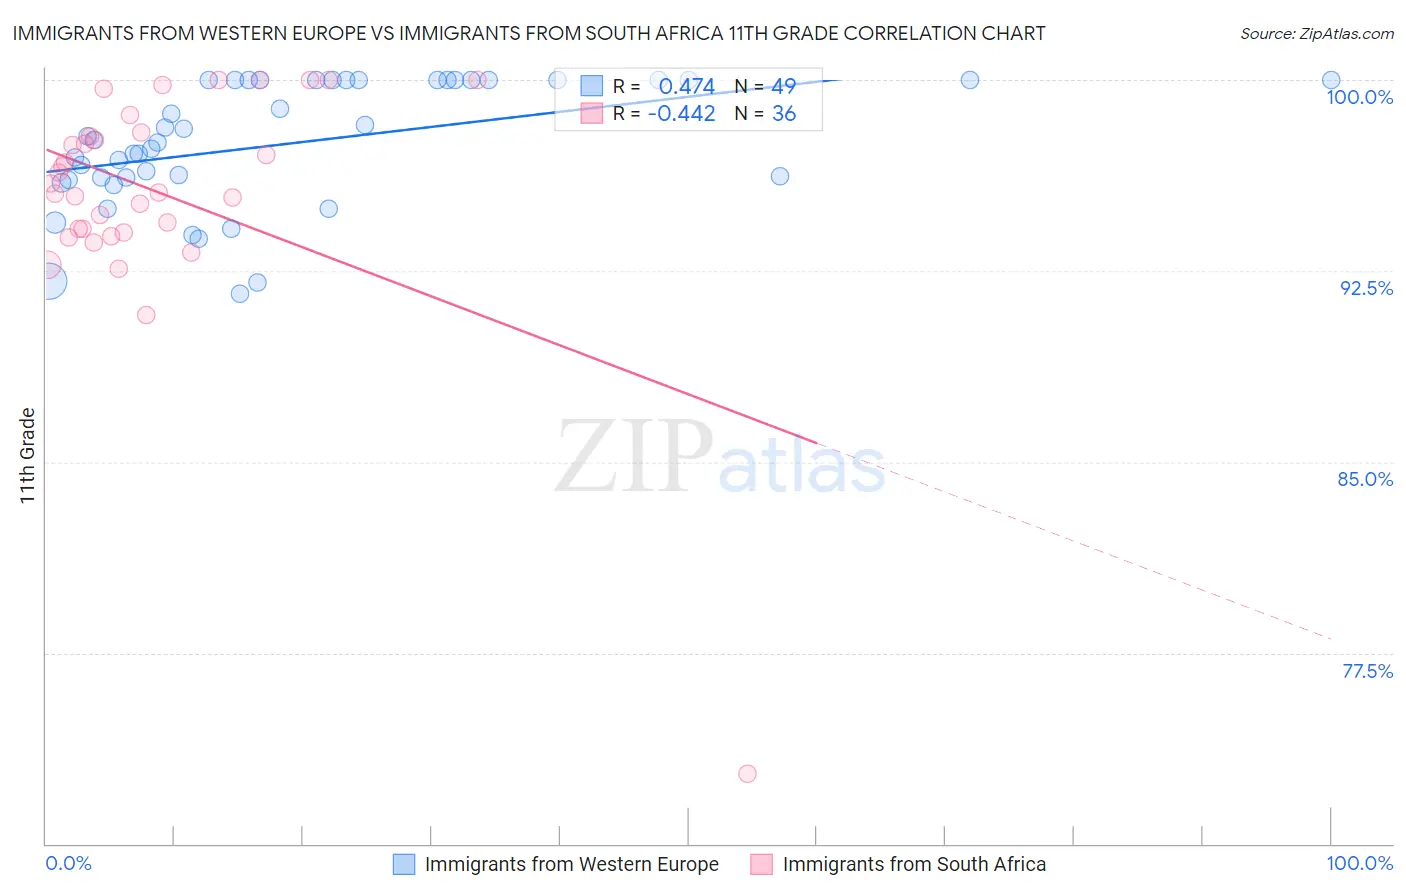
Immigrants from Western Europe vs Immigrants from South Africa 11th Grade Correlation Chart
The statistical analysis conducted on geographies consisting of 494,080,378 people shows a moderate positive correlation between the proportion of Immigrants from Western Europe and percentage of population with at least 11th grade education in the United States with a correlation coefficient (R) of 0.474 and weighted average of 93.6%. Similarly, the statistical analysis conducted on geographies consisting of 233,321,693 people shows a moderate negative correlation between the proportion of Immigrants from South Africa and percentage of population with at least 11th grade education in the United States with a correlation coefficient (R) of -0.442 and weighted average of 93.8%, a difference of 0.23%.
11th Grade Correlation Summary
| Measurement | Immigrants from Western Europe | Immigrants from South Africa |
| Minimum | 91.6% | 72.7% |
| Maximum | 100.0% | 100.0% |
| Range | 8.4% | 27.3% |
| Mean | 97.5% | 95.6% |
| Median | 97.6% | 95.8% |
| Interquartile 25% (IQ1) | 96.1% | 94.1% |
| Interquartile 75% (IQ3) | 100.0% | 97.8% |
| Interquartile Range (IQR) | 3.9% | 3.8% |
| Standard Deviation (Sample) | 2.4% | 4.6% |
| Standard Deviation (Population) | 2.4% | 4.6% |
Demographics Similar to Immigrants from Western Europe and Immigrants from South Africa by 11th Grade
In terms of 11th grade, the demographic groups most similar to Immigrants from Western Europe are Immigrants from South Central Asia (93.6%, a difference of 0.0%), Cambodian (93.6%, a difference of 0.0%), Burmese (93.6%, a difference of 0.0%), Immigrants from Switzerland (93.6%, a difference of 0.010%), and Icelander (93.6%, a difference of 0.020%). Similarly, the demographic groups most similar to Immigrants from South Africa are Immigrants from England (93.8%, a difference of 0.010%), Immigrants from Japan (93.8%, a difference of 0.030%), Romanian (93.8%, a difference of 0.050%), Immigrants from Czechoslovakia (93.8%, a difference of 0.050%), and Scotch-Irish (93.9%, a difference of 0.060%).
| Demographics | Rating | Rank | 11th Grade |
| Scotch-Irish | 99.8 /100 | #69 | Exceptional 93.9% |
| Immigrants | England | 99.7 /100 | #70 | Exceptional 93.8% |
| Immigrants | South Africa | 99.7 /100 | #71 | Exceptional 93.8% |
| Immigrants | Japan | 99.7 /100 | #72 | Exceptional 93.8% |
| Romanians | 99.6 /100 | #73 | Exceptional 93.8% |
| Immigrants | Czechoslovakia | 99.6 /100 | #74 | Exceptional 93.8% |
| Immigrants | Latvia | 99.6 /100 | #75 | Exceptional 93.8% |
| Celtics | 99.5 /100 | #76 | Exceptional 93.7% |
| Aleuts | 99.5 /100 | #77 | Exceptional 93.7% |
| Soviet Union | 99.5 /100 | #78 | Exceptional 93.7% |
| Immigrants | Denmark | 99.5 /100 | #79 | Exceptional 93.7% |
| Canadians | 99.5 /100 | #80 | Exceptional 93.7% |
| Immigrants | Moldova | 99.5 /100 | #81 | Exceptional 93.7% |
| Immigrants | Saudi Arabia | 99.3 /100 | #82 | Exceptional 93.7% |
| Icelanders | 99.3 /100 | #83 | Exceptional 93.6% |
| Immigrants | Taiwan | 99.3 /100 | #84 | Exceptional 93.6% |
| Immigrants | Switzerland | 99.3 /100 | #85 | Exceptional 93.6% |
| Immigrants | South Central Asia | 99.2 /100 | #86 | Exceptional 93.6% |
| Immigrants | Western Europe | 99.2 /100 | #87 | Exceptional 93.6% |
| Cambodians | 99.2 /100 | #88 | Exceptional 93.6% |
| Burmese | 99.2 /100 | #89 | Exceptional 93.6% |