Icelander vs Immigrants from Armenia 7th Grade
COMPARE
Icelander
Immigrants from Armenia
7th Grade
7th Grade Comparison
Icelanders
Immigrants from Armenia
96.7%
7TH GRADE
99.1/ 100
METRIC RATING
83rd/ 347
METRIC RANK
92.7%
7TH GRADE
0.0/ 100
METRIC RATING
333rd/ 347
METRIC RANK
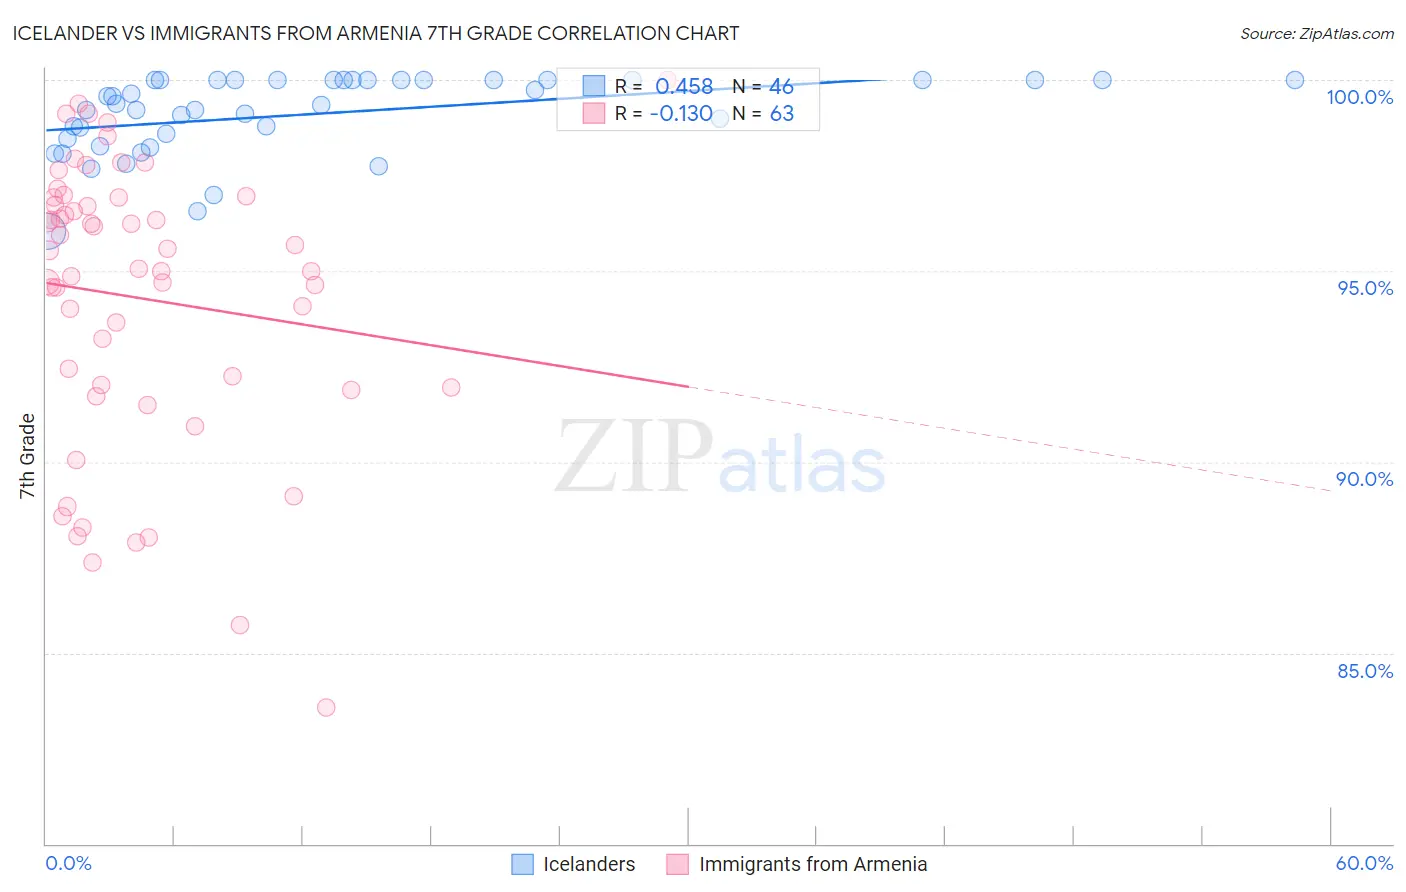
Icelander vs Immigrants from Armenia 7th Grade Correlation Chart
The statistical analysis conducted on geographies consisting of 159,668,975 people shows a moderate positive correlation between the proportion of Icelanders and percentage of population with at least 7th grade education in the United States with a correlation coefficient (R) of 0.458 and weighted average of 96.7%. Similarly, the statistical analysis conducted on geographies consisting of 97,657,339 people shows a poor negative correlation between the proportion of Immigrants from Armenia and percentage of population with at least 7th grade education in the United States with a correlation coefficient (R) of -0.130 and weighted average of 92.7%, a difference of 4.3%.
7th Grade Correlation Summary
| Measurement | Icelander | Immigrants from Armenia |
| Minimum | 96.0% | 83.6% |
| Maximum | 100.0% | 100.0% |
| Range | 4.0% | 16.4% |
| Mean | 99.1% | 94.3% |
| Median | 99.4% | 95.1% |
| Interquartile 25% (IQ1) | 98.5% | 91.9% |
| Interquartile 75% (IQ3) | 100.0% | 96.9% |
| Interquartile Range (IQR) | 1.5% | 5.0% |
| Standard Deviation (Sample) | 1.0% | 3.7% |
| Standard Deviation (Population) | 1.0% | 3.7% |
Similar Demographics by 7th Grade
Demographics Similar to Icelanders by 7th Grade
In terms of 7th grade, the demographic groups most similar to Icelanders are Romanian (96.7%, a difference of 0.0%), Delaware (96.8%, a difference of 0.010%), Chickasaw (96.7%, a difference of 0.010%), Kiowa (96.7%, a difference of 0.010%), and Turkish (96.7%, a difference of 0.010%).
| Demographics | Rating | Rank | 7th Grade |
| Immigrants | Ireland | 99.4 /100 | #76 | Exceptional 96.8% |
| Cherokee | 99.4 /100 | #77 | Exceptional 96.8% |
| Immigrants | Netherlands | 99.3 /100 | #78 | Exceptional 96.8% |
| Cypriots | 99.3 /100 | #79 | Exceptional 96.8% |
| Yugoslavians | 99.3 /100 | #80 | Exceptional 96.8% |
| Delaware | 99.2 /100 | #81 | Exceptional 96.8% |
| Chickasaw | 99.2 /100 | #82 | Exceptional 96.7% |
| Icelanders | 99.1 /100 | #83 | Exceptional 96.7% |
| Romanians | 99.1 /100 | #84 | Exceptional 96.7% |
| Kiowa | 99.1 /100 | #85 | Exceptional 96.7% |
| Turks | 99.1 /100 | #86 | Exceptional 96.7% |
| Immigrants | Belgium | 99.0 /100 | #87 | Exceptional 96.7% |
| Puget Sound Salish | 99.0 /100 | #88 | Exceptional 96.7% |
| Cree | 99.0 /100 | #89 | Exceptional 96.7% |
| Immigrants | South Africa | 98.9 /100 | #90 | Exceptional 96.7% |
Demographics Similar to Immigrants from Armenia by 7th Grade
In terms of 7th grade, the demographic groups most similar to Immigrants from Armenia are Hispanic or Latino (92.7%, a difference of 0.020%), Immigrants from Yemen (92.6%, a difference of 0.080%), Honduran (92.9%, a difference of 0.16%), Mexican American Indian (92.6%, a difference of 0.18%), and Immigrants from Dominican Republic (92.9%, a difference of 0.20%).
| Demographics | Rating | Rank | 7th Grade |
| Nepalese | 0.0 /100 | #326 | Tragic 93.2% |
| Immigrants | Cabo Verde | 0.0 /100 | #327 | Tragic 93.1% |
| Immigrants | Nicaragua | 0.0 /100 | #328 | Tragic 93.0% |
| Immigrants | Azores | 0.0 /100 | #329 | Tragic 93.0% |
| Immigrants | Dominican Republic | 0.0 /100 | #330 | Tragic 92.9% |
| Hondurans | 0.0 /100 | #331 | Tragic 92.9% |
| Hispanics or Latinos | 0.0 /100 | #332 | Tragic 92.7% |
| Immigrants | Armenia | 0.0 /100 | #333 | Tragic 92.7% |
| Immigrants | Yemen | 0.0 /100 | #334 | Tragic 92.6% |
| Mexican American Indians | 0.0 /100 | #335 | Tragic 92.6% |
| Immigrants | Honduras | 0.0 /100 | #336 | Tragic 92.5% |
| Immigrants | Latin America | 0.0 /100 | #337 | Tragic 92.2% |
| Central Americans | 0.0 /100 | #338 | Tragic 92.1% |
| Mexicans | 0.0 /100 | #339 | Tragic 91.9% |
| Yakama | 0.0 /100 | #340 | Tragic 91.7% |