Comanche vs Immigrants from Armenia 7th Grade
COMPARE
Comanche
Immigrants from Armenia
7th Grade
7th Grade Comparison
Comanche
Immigrants from Armenia
95.8%
7TH GRADE
21.1/ 100
METRIC RATING
203rd/ 347
METRIC RANK
92.7%
7TH GRADE
0.0/ 100
METRIC RATING
333rd/ 347
METRIC RANK
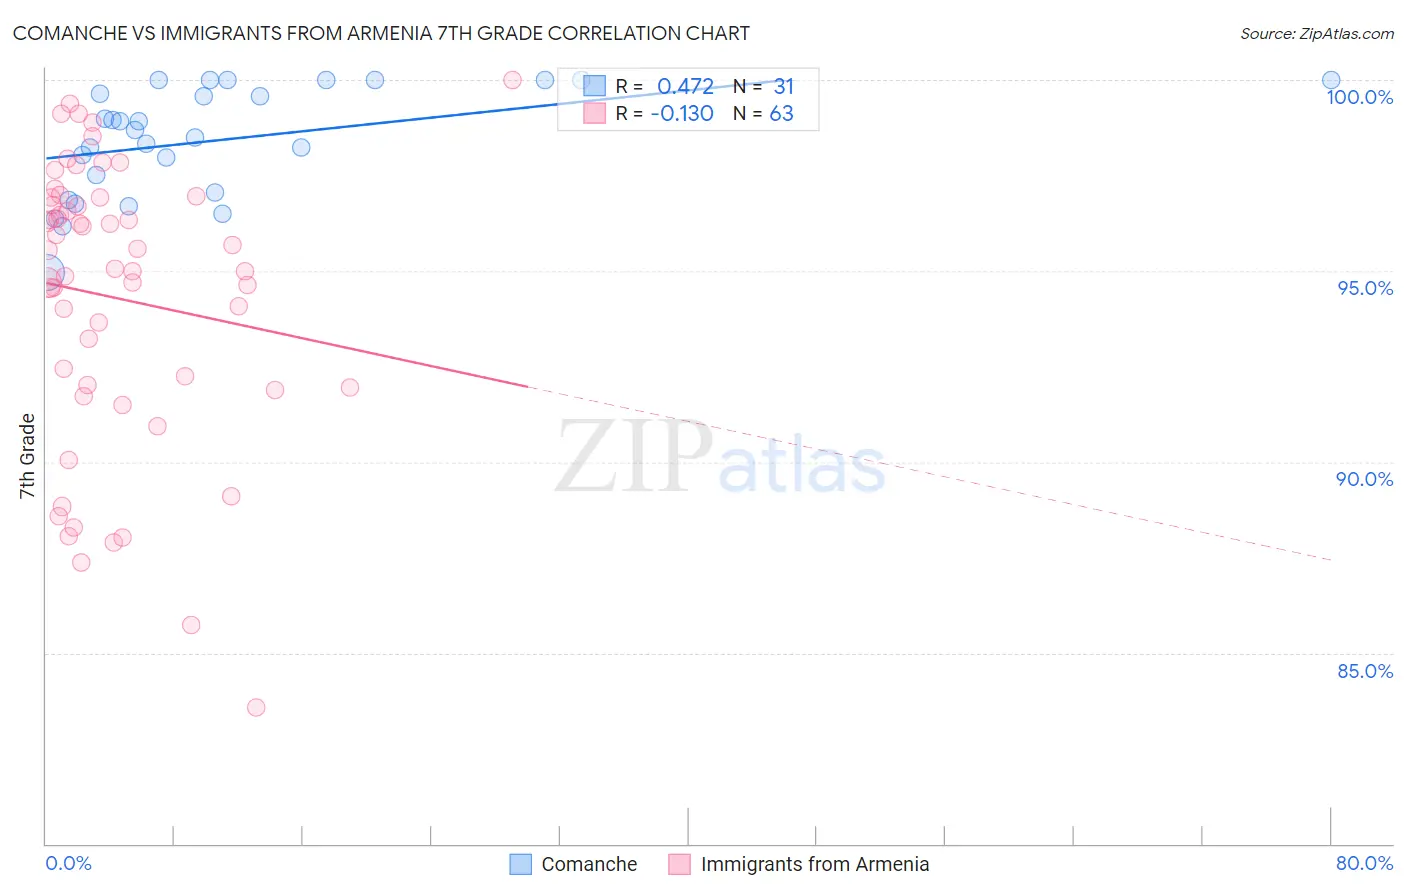
Comanche vs Immigrants from Armenia 7th Grade Correlation Chart
The statistical analysis conducted on geographies consisting of 109,786,530 people shows a moderate positive correlation between the proportion of Comanche and percentage of population with at least 7th grade education in the United States with a correlation coefficient (R) of 0.472 and weighted average of 95.8%. Similarly, the statistical analysis conducted on geographies consisting of 97,657,339 people shows a poor negative correlation between the proportion of Immigrants from Armenia and percentage of population with at least 7th grade education in the United States with a correlation coefficient (R) of -0.130 and weighted average of 92.7%, a difference of 3.4%.
7th Grade Correlation Summary
| Measurement | Comanche | Immigrants from Armenia |
| Minimum | 94.9% | 83.6% |
| Maximum | 100.0% | 100.0% |
| Range | 5.1% | 16.4% |
| Mean | 98.4% | 94.3% |
| Median | 98.7% | 95.1% |
| Interquartile 25% (IQ1) | 97.1% | 91.9% |
| Interquartile 75% (IQ3) | 100.0% | 96.9% |
| Interquartile Range (IQR) | 2.9% | 5.0% |
| Standard Deviation (Sample) | 1.4% | 3.7% |
| Standard Deviation (Population) | 1.4% | 3.7% |
Similar Demographics by 7th Grade
Demographics Similar to Comanche by 7th Grade
In terms of 7th grade, the demographic groups most similar to Comanche are Immigrants from Northern Africa (95.8%, a difference of 0.0%), Immigrants from Argentina (95.9%, a difference of 0.010%), Assyrian/Chaldean/Syriac (95.8%, a difference of 0.010%), Guamanian/Chamorro (95.9%, a difference of 0.020%), and Argentinean (95.9%, a difference of 0.020%).
| Demographics | Rating | Rank | 7th Grade |
| Apache | 27.6 /100 | #196 | Fair 95.9% |
| Immigrants | Zaire | 26.7 /100 | #197 | Fair 95.9% |
| Paraguayans | 24.8 /100 | #198 | Fair 95.9% |
| Guamanians/Chamorros | 23.5 /100 | #199 | Fair 95.9% |
| Argentineans | 23.2 /100 | #200 | Fair 95.9% |
| Immigrants | Argentina | 21.9 /100 | #201 | Fair 95.9% |
| Immigrants | Northern Africa | 21.4 /100 | #202 | Fair 95.8% |
| Comanche | 21.1 /100 | #203 | Fair 95.8% |
| Assyrians/Chaldeans/Syriacs | 20.5 /100 | #204 | Fair 95.8% |
| Moroccans | 18.9 /100 | #205 | Poor 95.8% |
| Africans | 17.6 /100 | #206 | Poor 95.8% |
| Navajo | 17.0 /100 | #207 | Poor 95.8% |
| Immigrants | Sudan | 17.0 /100 | #208 | Poor 95.8% |
| Dutch West Indians | 16.1 /100 | #209 | Poor 95.8% |
| Hawaiians | 16.0 /100 | #210 | Poor 95.8% |
Demographics Similar to Immigrants from Armenia by 7th Grade
In terms of 7th grade, the demographic groups most similar to Immigrants from Armenia are Hispanic or Latino (92.7%, a difference of 0.020%), Immigrants from Yemen (92.6%, a difference of 0.080%), Honduran (92.9%, a difference of 0.16%), Mexican American Indian (92.6%, a difference of 0.18%), and Immigrants from Dominican Republic (92.9%, a difference of 0.20%).
| Demographics | Rating | Rank | 7th Grade |
| Nepalese | 0.0 /100 | #326 | Tragic 93.2% |
| Immigrants | Cabo Verde | 0.0 /100 | #327 | Tragic 93.1% |
| Immigrants | Nicaragua | 0.0 /100 | #328 | Tragic 93.0% |
| Immigrants | Azores | 0.0 /100 | #329 | Tragic 93.0% |
| Immigrants | Dominican Republic | 0.0 /100 | #330 | Tragic 92.9% |
| Hondurans | 0.0 /100 | #331 | Tragic 92.9% |
| Hispanics or Latinos | 0.0 /100 | #332 | Tragic 92.7% |
| Immigrants | Armenia | 0.0 /100 | #333 | Tragic 92.7% |
| Immigrants | Yemen | 0.0 /100 | #334 | Tragic 92.6% |
| Mexican American Indians | 0.0 /100 | #335 | Tragic 92.6% |
| Immigrants | Honduras | 0.0 /100 | #336 | Tragic 92.5% |
| Immigrants | Latin America | 0.0 /100 | #337 | Tragic 92.2% |
| Central Americans | 0.0 /100 | #338 | Tragic 92.1% |
| Mexicans | 0.0 /100 | #339 | Tragic 91.9% |
| Yakama | 0.0 /100 | #340 | Tragic 91.7% |