Lithuanian vs Houma Doctorate Degree
COMPARE
Lithuanian
Houma
Doctorate Degree
Doctorate Degree Comparison
Lithuanians
Houma
2.3%
DOCTORATE DEGREE
99.8/ 100
METRIC RATING
70th/ 347
METRIC RANK
0.96%
DOCTORATE DEGREE
0.0/ 100
METRIC RATING
347th/ 347
METRIC RANK
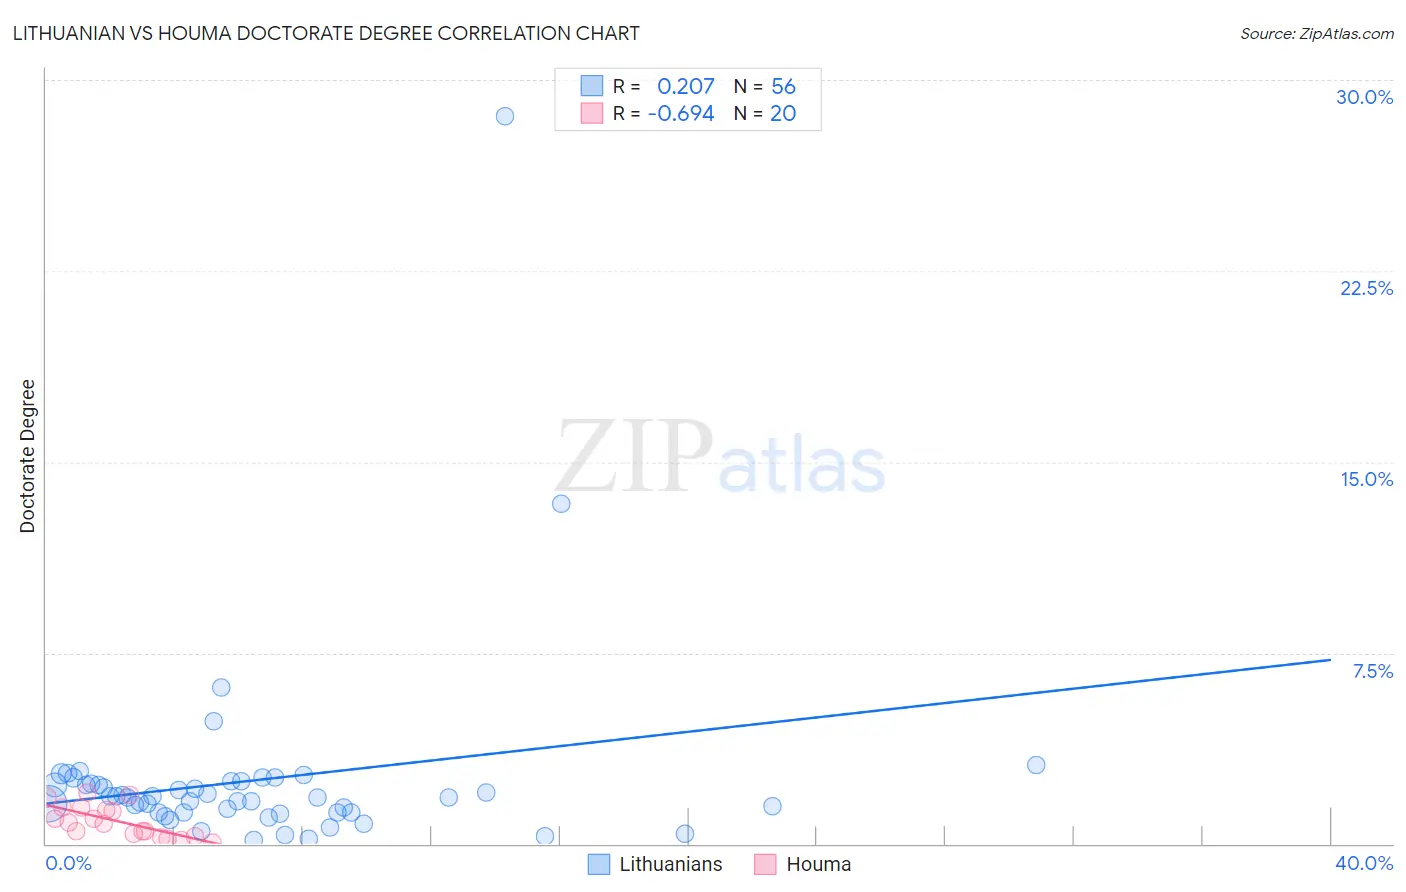
Lithuanian vs Houma Doctorate Degree Correlation Chart
The statistical analysis conducted on geographies consisting of 417,147,177 people shows a weak positive correlation between the proportion of Lithuanians and percentage of population with at least doctorate degree education in the United States with a correlation coefficient (R) of 0.207 and weighted average of 2.3%. Similarly, the statistical analysis conducted on geographies consisting of 36,552,567 people shows a significant negative correlation between the proportion of Houma and percentage of population with at least doctorate degree education in the United States with a correlation coefficient (R) of -0.694 and weighted average of 0.96%, a difference of 135.7%.
Doctorate Degree Correlation Summary
| Measurement | Lithuanian | Houma |
| Minimum | 0.13% | 0.036% |
| Maximum | 28.6% | 2.0% |
| Range | 28.4% | 2.0% |
| Mean | 2.5% | 0.88% |
| Median | 1.8% | 0.82% |
| Interquartile 25% (IQ1) | 1.2% | 0.35% |
| Interquartile 75% (IQ3) | 2.4% | 1.4% |
| Interquartile Range (IQR) | 1.2% | 1.0% |
| Standard Deviation (Sample) | 4.0% | 0.62% |
| Standard Deviation (Population) | 4.0% | 0.60% |
Similar Demographics by Doctorate Degree
Demographics Similar to Lithuanians by Doctorate Degree
In terms of doctorate degree, the demographic groups most similar to Lithuanians are Immigrants from Bolivia (2.3%, a difference of 0.0%), Carpatho Rusyn (2.3%, a difference of 0.14%), Immigrants from Canada (2.3%, a difference of 0.16%), Immigrants from Bulgaria (2.3%, a difference of 0.24%), and Immigrants from North America (2.2%, a difference of 0.38%).
| Demographics | Rating | Rank | Doctorate Degree |
| Laotians | 99.9 /100 | #63 | Exceptional 2.3% |
| Immigrants | Greece | 99.9 /100 | #64 | Exceptional 2.3% |
| Paraguayans | 99.9 /100 | #65 | Exceptional 2.3% |
| Argentineans | 99.9 /100 | #66 | Exceptional 2.3% |
| Zimbabweans | 99.8 /100 | #67 | Exceptional 2.3% |
| Immigrants | Kazakhstan | 99.8 /100 | #68 | Exceptional 2.3% |
| Carpatho Rusyns | 99.8 /100 | #69 | Exceptional 2.3% |
| Lithuanians | 99.8 /100 | #70 | Exceptional 2.3% |
| Immigrants | Bolivia | 99.8 /100 | #71 | Exceptional 2.3% |
| Immigrants | Canada | 99.8 /100 | #72 | Exceptional 2.3% |
| Immigrants | Bulgaria | 99.8 /100 | #73 | Exceptional 2.3% |
| Immigrants | North America | 99.8 /100 | #74 | Exceptional 2.2% |
| Immigrants | Western Asia | 99.8 /100 | #75 | Exceptional 2.2% |
| Immigrants | Hungary | 99.8 /100 | #76 | Exceptional 2.2% |
| Immigrants | Lebanon | 99.8 /100 | #77 | Exceptional 2.2% |
Demographics Similar to Houma by Doctorate Degree
In terms of doctorate degree, the demographic groups most similar to Houma are Spanish American Indian (1.1%, a difference of 10.5%), Lumbee (1.1%, a difference of 13.7%), Immigrants from Mexico (1.1%, a difference of 15.3%), Fijian (1.1%, a difference of 17.8%), and Arapaho (1.2%, a difference of 21.8%).
| Demographics | Rating | Rank | Doctorate Degree |
| Immigrants | Caribbean | 0.0 /100 | #333 | Tragic 1.3% |
| Immigrants | Dominican Republic | 0.0 /100 | #334 | Tragic 1.3% |
| Immigrants | Haiti | 0.0 /100 | #335 | Tragic 1.3% |
| Nepalese | 0.0 /100 | #336 | Tragic 1.3% |
| Bangladeshis | 0.0 /100 | #337 | Tragic 1.2% |
| Puget Sound Salish | 0.0 /100 | #338 | Tragic 1.2% |
| Immigrants | Central America | 0.0 /100 | #339 | Tragic 1.2% |
| Immigrants | Cuba | 0.0 /100 | #340 | Tragic 1.2% |
| Mexicans | 0.0 /100 | #341 | Tragic 1.2% |
| Arapaho | 0.0 /100 | #342 | Tragic 1.2% |
| Fijians | 0.0 /100 | #343 | Tragic 1.1% |
| Immigrants | Mexico | 0.0 /100 | #344 | Tragic 1.1% |
| Lumbee | 0.0 /100 | #345 | Tragic 1.1% |
| Spanish American Indians | 0.0 /100 | #346 | Tragic 1.1% |
| Houma | 0.0 /100 | #347 | Tragic 0.96% |