Iranian vs Houma Doctorate Degree
COMPARE
Iranian
Houma
Doctorate Degree
Doctorate Degree Comparison
Iranians
Houma
3.1%
DOCTORATE DEGREE
100.0/ 100
METRIC RATING
5th/ 347
METRIC RANK
0.96%
DOCTORATE DEGREE
0.0/ 100
METRIC RATING
347th/ 347
METRIC RANK
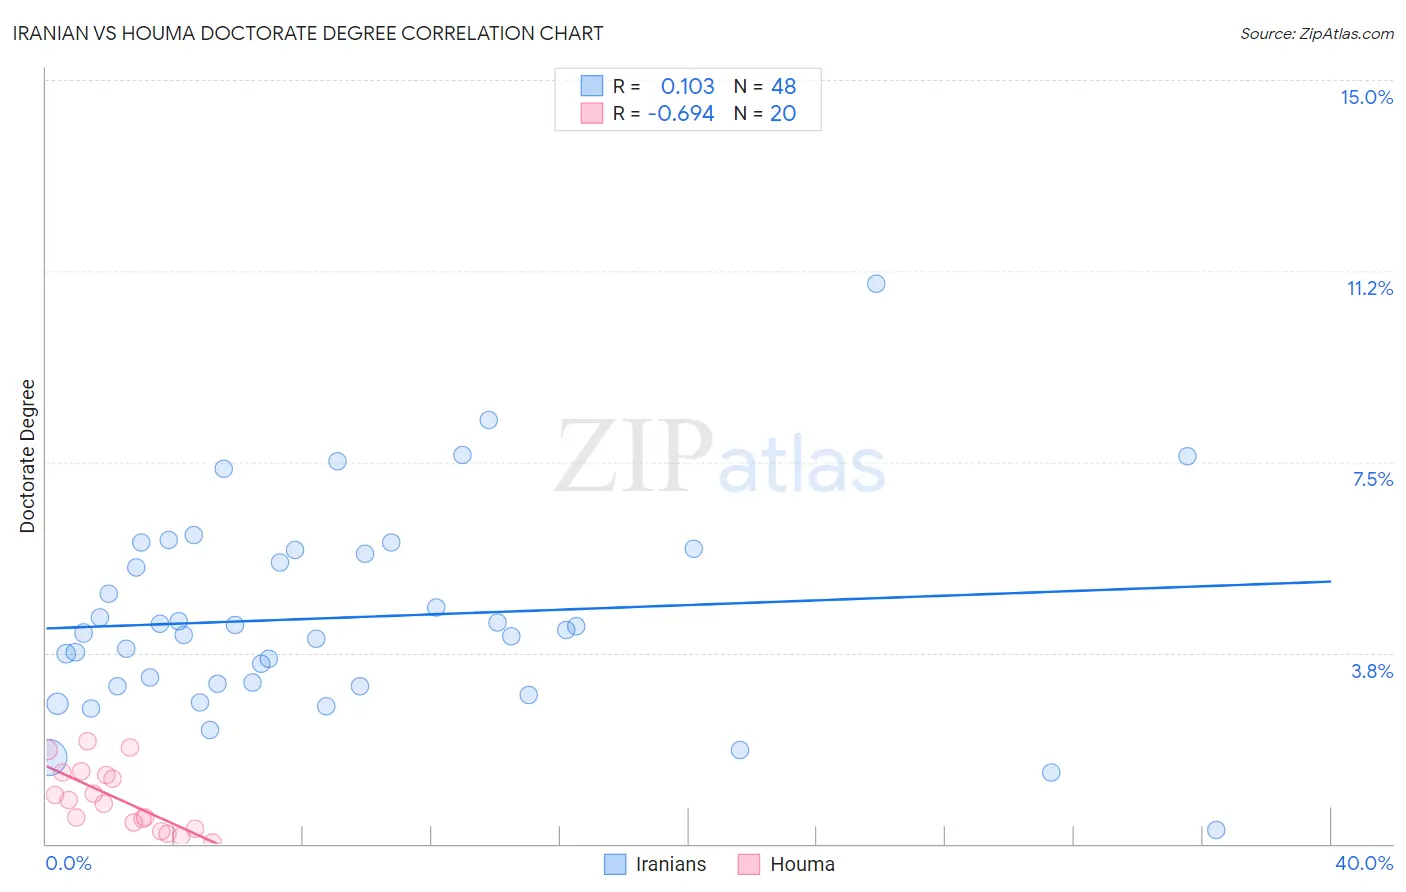
Iranian vs Houma Doctorate Degree Correlation Chart
The statistical analysis conducted on geographies consisting of 315,770,820 people shows a poor positive correlation between the proportion of Iranians and percentage of population with at least doctorate degree education in the United States with a correlation coefficient (R) of 0.103 and weighted average of 3.1%. Similarly, the statistical analysis conducted on geographies consisting of 36,552,567 people shows a significant negative correlation between the proportion of Houma and percentage of population with at least doctorate degree education in the United States with a correlation coefficient (R) of -0.694 and weighted average of 0.96%, a difference of 228.5%.
Doctorate Degree Correlation Summary
| Measurement | Iranian | Houma |
| Minimum | 0.26% | 0.036% |
| Maximum | 11.0% | 2.0% |
| Range | 10.7% | 2.0% |
| Mean | 4.4% | 0.88% |
| Median | 4.2% | 0.82% |
| Interquartile 25% (IQ1) | 3.1% | 0.35% |
| Interquartile 75% (IQ3) | 5.7% | 1.4% |
| Interquartile Range (IQR) | 2.6% | 1.0% |
| Standard Deviation (Sample) | 2.0% | 0.62% |
| Standard Deviation (Population) | 2.0% | 0.60% |
Similar Demographics by Doctorate Degree
Demographics Similar to Iranians by Doctorate Degree
In terms of doctorate degree, the demographic groups most similar to Iranians are Immigrants from Taiwan (3.2%, a difference of 1.5%), Immigrants from Switzerland (3.1%, a difference of 1.9%), Immigrants from China (3.1%, a difference of 2.0%), Immigrants from Israel (3.0%, a difference of 3.3%), and Immigrants from Iran (3.0%, a difference of 4.0%).
| Demographics | Rating | Rank | Doctorate Degree |
| Immigrants | Singapore | 100.0 /100 | #1 | Exceptional 3.7% |
| Filipinos | 100.0 /100 | #2 | Exceptional 3.4% |
| Okinawans | 100.0 /100 | #3 | Exceptional 3.3% |
| Immigrants | Taiwan | 100.0 /100 | #4 | Exceptional 3.2% |
| Iranians | 100.0 /100 | #5 | Exceptional 3.1% |
| Immigrants | Switzerland | 100.0 /100 | #6 | Exceptional 3.1% |
| Immigrants | China | 100.0 /100 | #7 | Exceptional 3.1% |
| Immigrants | Israel | 100.0 /100 | #8 | Exceptional 3.0% |
| Immigrants | Iran | 100.0 /100 | #9 | Exceptional 3.0% |
| Immigrants | Eastern Asia | 100.0 /100 | #10 | Exceptional 3.0% |
| Indians (Asian) | 100.0 /100 | #11 | Exceptional 2.9% |
| Immigrants | Belgium | 100.0 /100 | #12 | Exceptional 2.9% |
| Immigrants | Sweden | 100.0 /100 | #13 | Exceptional 2.9% |
| Immigrants | France | 100.0 /100 | #14 | Exceptional 2.9% |
| Immigrants | India | 100.0 /100 | #15 | Exceptional 2.8% |
Demographics Similar to Houma by Doctorate Degree
In terms of doctorate degree, the demographic groups most similar to Houma are Spanish American Indian (1.1%, a difference of 10.5%), Lumbee (1.1%, a difference of 13.7%), Immigrants from Mexico (1.1%, a difference of 15.3%), Fijian (1.1%, a difference of 17.8%), and Arapaho (1.2%, a difference of 21.8%).
| Demographics | Rating | Rank | Doctorate Degree |
| Immigrants | Caribbean | 0.0 /100 | #333 | Tragic 1.3% |
| Immigrants | Dominican Republic | 0.0 /100 | #334 | Tragic 1.3% |
| Immigrants | Haiti | 0.0 /100 | #335 | Tragic 1.3% |
| Nepalese | 0.0 /100 | #336 | Tragic 1.3% |
| Bangladeshis | 0.0 /100 | #337 | Tragic 1.2% |
| Puget Sound Salish | 0.0 /100 | #338 | Tragic 1.2% |
| Immigrants | Central America | 0.0 /100 | #339 | Tragic 1.2% |
| Immigrants | Cuba | 0.0 /100 | #340 | Tragic 1.2% |
| Mexicans | 0.0 /100 | #341 | Tragic 1.2% |
| Arapaho | 0.0 /100 | #342 | Tragic 1.2% |
| Fijians | 0.0 /100 | #343 | Tragic 1.1% |
| Immigrants | Mexico | 0.0 /100 | #344 | Tragic 1.1% |
| Lumbee | 0.0 /100 | #345 | Tragic 1.1% |
| Spanish American Indians | 0.0 /100 | #346 | Tragic 1.1% |
| Houma | 0.0 /100 | #347 | Tragic 0.96% |