Lithuanian vs Cuban Doctorate Degree
COMPARE
Lithuanian
Cuban
Doctorate Degree
Doctorate Degree Comparison
Lithuanians
Cubans
2.3%
DOCTORATE DEGREE
99.8/ 100
METRIC RATING
70th/ 347
METRIC RANK
1.4%
DOCTORATE DEGREE
0.1/ 100
METRIC RATING
307th/ 347
METRIC RANK
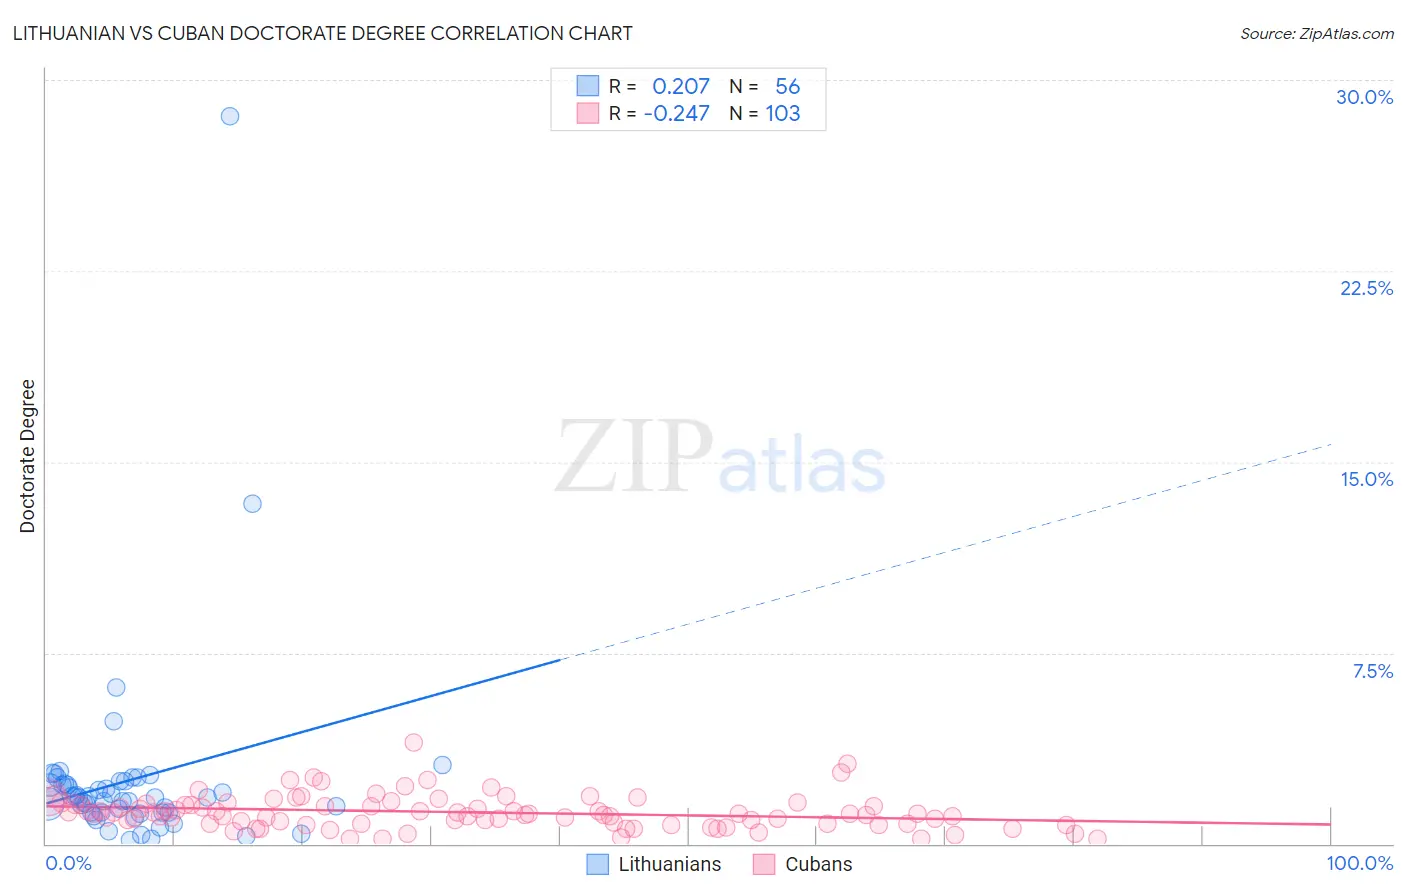
Lithuanian vs Cuban Doctorate Degree Correlation Chart
The statistical analysis conducted on geographies consisting of 417,147,177 people shows a weak positive correlation between the proportion of Lithuanians and percentage of population with at least doctorate degree education in the United States with a correlation coefficient (R) of 0.207 and weighted average of 2.3%. Similarly, the statistical analysis conducted on geographies consisting of 443,089,370 people shows a weak negative correlation between the proportion of Cubans and percentage of population with at least doctorate degree education in the United States with a correlation coefficient (R) of -0.247 and weighted average of 1.4%, a difference of 64.0%.
Doctorate Degree Correlation Summary
| Measurement | Lithuanian | Cuban |
| Minimum | 0.13% | 0.18% |
| Maximum | 28.6% | 4.0% |
| Range | 28.4% | 3.8% |
| Mean | 2.5% | 1.2% |
| Median | 1.8% | 1.2% |
| Interquartile 25% (IQ1) | 1.2% | 0.79% |
| Interquartile 75% (IQ3) | 2.4% | 1.6% |
| Interquartile Range (IQR) | 1.2% | 0.76% |
| Standard Deviation (Sample) | 4.0% | 0.65% |
| Standard Deviation (Population) | 4.0% | 0.65% |
Similar Demographics by Doctorate Degree
Demographics Similar to Lithuanians by Doctorate Degree
In terms of doctorate degree, the demographic groups most similar to Lithuanians are Immigrants from Bolivia (2.3%, a difference of 0.0%), Carpatho Rusyn (2.3%, a difference of 0.14%), Immigrants from Canada (2.3%, a difference of 0.16%), Immigrants from Bulgaria (2.3%, a difference of 0.24%), and Immigrants from North America (2.2%, a difference of 0.38%).
| Demographics | Rating | Rank | Doctorate Degree |
| Laotians | 99.9 /100 | #63 | Exceptional 2.3% |
| Immigrants | Greece | 99.9 /100 | #64 | Exceptional 2.3% |
| Paraguayans | 99.9 /100 | #65 | Exceptional 2.3% |
| Argentineans | 99.9 /100 | #66 | Exceptional 2.3% |
| Zimbabweans | 99.8 /100 | #67 | Exceptional 2.3% |
| Immigrants | Kazakhstan | 99.8 /100 | #68 | Exceptional 2.3% |
| Carpatho Rusyns | 99.8 /100 | #69 | Exceptional 2.3% |
| Lithuanians | 99.8 /100 | #70 | Exceptional 2.3% |
| Immigrants | Bolivia | 99.8 /100 | #71 | Exceptional 2.3% |
| Immigrants | Canada | 99.8 /100 | #72 | Exceptional 2.3% |
| Immigrants | Bulgaria | 99.8 /100 | #73 | Exceptional 2.3% |
| Immigrants | North America | 99.8 /100 | #74 | Exceptional 2.2% |
| Immigrants | Western Asia | 99.8 /100 | #75 | Exceptional 2.2% |
| Immigrants | Hungary | 99.8 /100 | #76 | Exceptional 2.2% |
| Immigrants | Lebanon | 99.8 /100 | #77 | Exceptional 2.2% |
Demographics Similar to Cubans by Doctorate Degree
In terms of doctorate degree, the demographic groups most similar to Cubans are Immigrants from Laos (1.4%, a difference of 0.050%), Guyanese (1.4%, a difference of 0.25%), Pennsylvania German (1.4%, a difference of 0.26%), Mexican American Indian (1.4%, a difference of 0.40%), and Immigrants from Dominica (1.4%, a difference of 0.45%).
| Demographics | Rating | Rank | Doctorate Degree |
| Immigrants | Guatemala | 0.1 /100 | #300 | Tragic 1.4% |
| Hondurans | 0.1 /100 | #301 | Tragic 1.4% |
| Shoshone | 0.1 /100 | #302 | Tragic 1.4% |
| Immigrants | Dominica | 0.1 /100 | #303 | Tragic 1.4% |
| Mexican American Indians | 0.1 /100 | #304 | Tragic 1.4% |
| Pennsylvania Germans | 0.1 /100 | #305 | Tragic 1.4% |
| Guyanese | 0.1 /100 | #306 | Tragic 1.4% |
| Cubans | 0.1 /100 | #307 | Tragic 1.4% |
| Immigrants | Laos | 0.1 /100 | #308 | Tragic 1.4% |
| Immigrants | Grenada | 0.1 /100 | #309 | Tragic 1.4% |
| Immigrants | Jamaica | 0.1 /100 | #310 | Tragic 1.4% |
| Immigrants | Honduras | 0.1 /100 | #311 | Tragic 1.4% |
| Immigrants | Nicaragua | 0.1 /100 | #312 | Tragic 1.4% |
| Menominee | 0.1 /100 | #313 | Tragic 1.4% |
| Dominicans | 0.1 /100 | #314 | Tragic 1.4% |