Lithuanian vs Immigrants from Eritrea Doctorate Degree
COMPARE
Lithuanian
Immigrants from Eritrea
Doctorate Degree
Doctorate Degree Comparison
Lithuanians
Immigrants from Eritrea
2.3%
DOCTORATE DEGREE
99.8/ 100
METRIC RATING
70th/ 347
METRIC RANK
2.1%
DOCTORATE DEGREE
98.4/ 100
METRIC RATING
97th/ 347
METRIC RANK
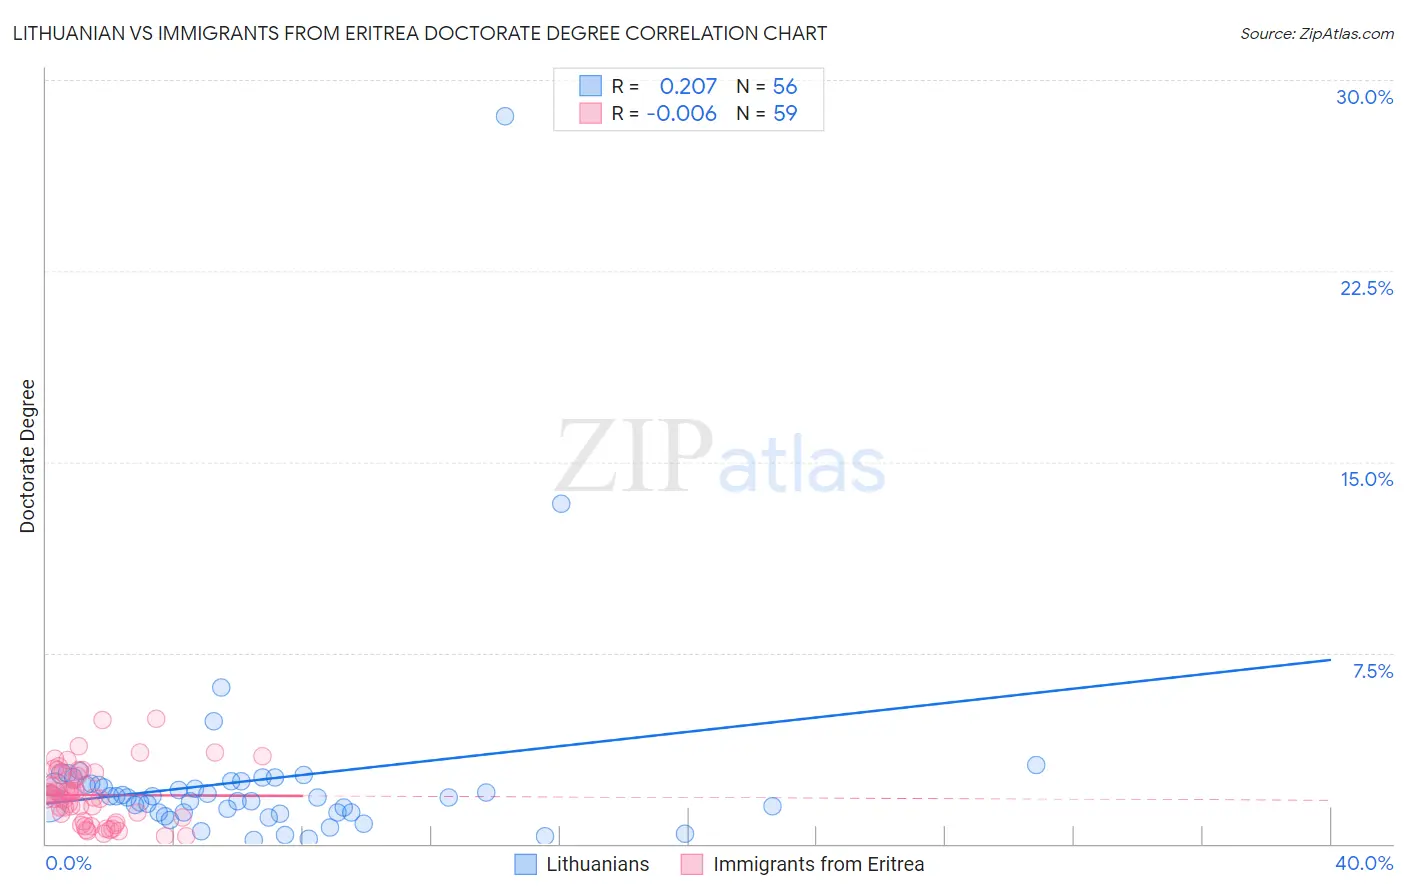
Lithuanian vs Immigrants from Eritrea Doctorate Degree Correlation Chart
The statistical analysis conducted on geographies consisting of 417,147,177 people shows a weak positive correlation between the proportion of Lithuanians and percentage of population with at least doctorate degree education in the United States with a correlation coefficient (R) of 0.207 and weighted average of 2.3%. Similarly, the statistical analysis conducted on geographies consisting of 104,687,431 people shows no correlation between the proportion of Immigrants from Eritrea and percentage of population with at least doctorate degree education in the United States with a correlation coefficient (R) of -0.006 and weighted average of 2.1%, a difference of 6.8%.
Doctorate Degree Correlation Summary
| Measurement | Lithuanian | Immigrants from Eritrea |
| Minimum | 0.13% | 0.28% |
| Maximum | 28.6% | 4.9% |
| Range | 28.4% | 4.6% |
| Mean | 2.5% | 1.9% |
| Median | 1.8% | 1.8% |
| Interquartile 25% (IQ1) | 1.2% | 0.88% |
| Interquartile 75% (IQ3) | 2.4% | 2.8% |
| Interquartile Range (IQR) | 1.2% | 1.9% |
| Standard Deviation (Sample) | 4.0% | 1.1% |
| Standard Deviation (Population) | 4.0% | 1.1% |
Similar Demographics by Doctorate Degree
Demographics Similar to Lithuanians by Doctorate Degree
In terms of doctorate degree, the demographic groups most similar to Lithuanians are Immigrants from Bolivia (2.3%, a difference of 0.0%), Carpatho Rusyn (2.3%, a difference of 0.14%), Immigrants from Canada (2.3%, a difference of 0.16%), Immigrants from Bulgaria (2.3%, a difference of 0.24%), and Immigrants from North America (2.2%, a difference of 0.38%).
| Demographics | Rating | Rank | Doctorate Degree |
| Laotians | 99.9 /100 | #63 | Exceptional 2.3% |
| Immigrants | Greece | 99.9 /100 | #64 | Exceptional 2.3% |
| Paraguayans | 99.9 /100 | #65 | Exceptional 2.3% |
| Argentineans | 99.9 /100 | #66 | Exceptional 2.3% |
| Zimbabweans | 99.8 /100 | #67 | Exceptional 2.3% |
| Immigrants | Kazakhstan | 99.8 /100 | #68 | Exceptional 2.3% |
| Carpatho Rusyns | 99.8 /100 | #69 | Exceptional 2.3% |
| Lithuanians | 99.8 /100 | #70 | Exceptional 2.3% |
| Immigrants | Bolivia | 99.8 /100 | #71 | Exceptional 2.3% |
| Immigrants | Canada | 99.8 /100 | #72 | Exceptional 2.3% |
| Immigrants | Bulgaria | 99.8 /100 | #73 | Exceptional 2.3% |
| Immigrants | North America | 99.8 /100 | #74 | Exceptional 2.2% |
| Immigrants | Western Asia | 99.8 /100 | #75 | Exceptional 2.2% |
| Immigrants | Hungary | 99.8 /100 | #76 | Exceptional 2.2% |
| Immigrants | Lebanon | 99.8 /100 | #77 | Exceptional 2.2% |
Demographics Similar to Immigrants from Eritrea by Doctorate Degree
In terms of doctorate degree, the demographic groups most similar to Immigrants from Eritrea are Armenian (2.1%, a difference of 0.080%), Immigrants from Northern Africa (2.1%, a difference of 0.13%), Immigrants from Egypt (2.1%, a difference of 0.26%), Immigrants from Eastern Europe (2.1%, a difference of 0.26%), and Immigrants from Eastern Africa (2.1%, a difference of 0.29%).
| Demographics | Rating | Rank | Doctorate Degree |
| Immigrants | Scotland | 99.2 /100 | #90 | Exceptional 2.2% |
| Immigrants | Sudan | 99.1 /100 | #91 | Exceptional 2.2% |
| Chileans | 99.1 /100 | #92 | Exceptional 2.2% |
| Alsatians | 99.0 /100 | #93 | Exceptional 2.1% |
| Greeks | 98.8 /100 | #94 | Exceptional 2.1% |
| Immigrants | Romania | 98.7 /100 | #95 | Exceptional 2.1% |
| Immigrants | Northern Africa | 98.4 /100 | #96 | Exceptional 2.1% |
| Immigrants | Eritrea | 98.4 /100 | #97 | Exceptional 2.1% |
| Armenians | 98.3 /100 | #98 | Exceptional 2.1% |
| Immigrants | Egypt | 98.2 /100 | #99 | Exceptional 2.1% |
| Immigrants | Eastern Europe | 98.2 /100 | #100 | Exceptional 2.1% |
| Immigrants | Eastern Africa | 98.2 /100 | #101 | Exceptional 2.1% |
| Immigrants | Chile | 98.1 /100 | #102 | Exceptional 2.1% |
| Romanians | 98.1 /100 | #103 | Exceptional 2.1% |
| Austrians | 98.0 /100 | #104 | Exceptional 2.1% |