Lithuanian vs Burmese Doctorate Degree
COMPARE
Lithuanian
Burmese
Doctorate Degree
Doctorate Degree Comparison
Lithuanians
Burmese
2.3%
DOCTORATE DEGREE
99.8/ 100
METRIC RATING
70th/ 347
METRIC RANK
2.6%
DOCTORATE DEGREE
100.0/ 100
METRIC RATING
28th/ 347
METRIC RANK
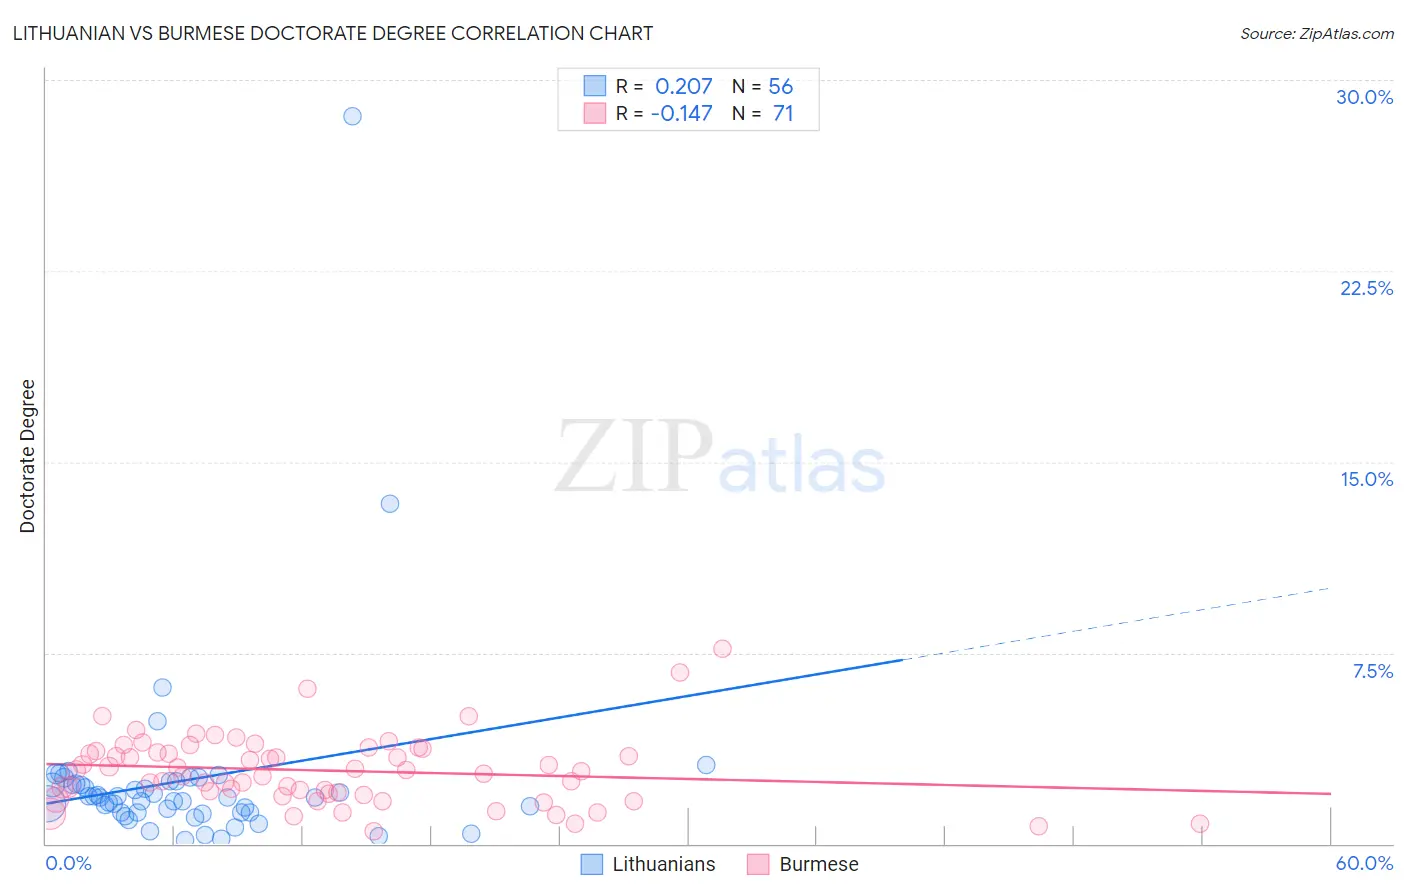
Lithuanian vs Burmese Doctorate Degree Correlation Chart
The statistical analysis conducted on geographies consisting of 417,147,177 people shows a weak positive correlation between the proportion of Lithuanians and percentage of population with at least doctorate degree education in the United States with a correlation coefficient (R) of 0.207 and weighted average of 2.3%. Similarly, the statistical analysis conducted on geographies consisting of 459,661,532 people shows a poor negative correlation between the proportion of Burmese and percentage of population with at least doctorate degree education in the United States with a correlation coefficient (R) of -0.147 and weighted average of 2.6%, a difference of 16.7%.
Doctorate Degree Correlation Summary
| Measurement | Lithuanian | Burmese |
| Minimum | 0.13% | 0.47% |
| Maximum | 28.6% | 7.7% |
| Range | 28.4% | 7.2% |
| Mean | 2.5% | 2.9% |
| Median | 1.8% | 2.9% |
| Interquartile 25% (IQ1) | 1.2% | 2.0% |
| Interquartile 75% (IQ3) | 2.4% | 3.6% |
| Interquartile Range (IQR) | 1.2% | 1.7% |
| Standard Deviation (Sample) | 4.0% | 1.4% |
| Standard Deviation (Population) | 4.0% | 1.3% |
Similar Demographics by Doctorate Degree
Demographics Similar to Lithuanians by Doctorate Degree
In terms of doctorate degree, the demographic groups most similar to Lithuanians are Immigrants from Bolivia (2.3%, a difference of 0.0%), Carpatho Rusyn (2.3%, a difference of 0.14%), Immigrants from Canada (2.3%, a difference of 0.16%), Immigrants from Bulgaria (2.3%, a difference of 0.24%), and Immigrants from North America (2.2%, a difference of 0.38%).
| Demographics | Rating | Rank | Doctorate Degree |
| Laotians | 99.9 /100 | #63 | Exceptional 2.3% |
| Immigrants | Greece | 99.9 /100 | #64 | Exceptional 2.3% |
| Paraguayans | 99.9 /100 | #65 | Exceptional 2.3% |
| Argentineans | 99.9 /100 | #66 | Exceptional 2.3% |
| Zimbabweans | 99.8 /100 | #67 | Exceptional 2.3% |
| Immigrants | Kazakhstan | 99.8 /100 | #68 | Exceptional 2.3% |
| Carpatho Rusyns | 99.8 /100 | #69 | Exceptional 2.3% |
| Lithuanians | 99.8 /100 | #70 | Exceptional 2.3% |
| Immigrants | Bolivia | 99.8 /100 | #71 | Exceptional 2.3% |
| Immigrants | Canada | 99.8 /100 | #72 | Exceptional 2.3% |
| Immigrants | Bulgaria | 99.8 /100 | #73 | Exceptional 2.3% |
| Immigrants | North America | 99.8 /100 | #74 | Exceptional 2.2% |
| Immigrants | Western Asia | 99.8 /100 | #75 | Exceptional 2.2% |
| Immigrants | Hungary | 99.8 /100 | #76 | Exceptional 2.2% |
| Immigrants | Lebanon | 99.8 /100 | #77 | Exceptional 2.2% |
Demographics Similar to Burmese by Doctorate Degree
In terms of doctorate degree, the demographic groups most similar to Burmese are Immigrants from South Central Asia (2.6%, a difference of 0.26%), Immigrants from Turkey (2.6%, a difference of 0.30%), Immigrants from Korea (2.6%, a difference of 0.30%), Turkish (2.7%, a difference of 1.2%), and Immigrants from Saudi Arabia (2.7%, a difference of 1.7%).
| Demographics | Rating | Rank | Doctorate Degree |
| Thais | 100.0 /100 | #21 | Exceptional 2.8% |
| Mongolians | 100.0 /100 | #22 | Exceptional 2.8% |
| Immigrants | Denmark | 100.0 /100 | #23 | Exceptional 2.8% |
| Israelis | 100.0 /100 | #24 | Exceptional 2.7% |
| Immigrants | Saudi Arabia | 100.0 /100 | #25 | Exceptional 2.7% |
| Turks | 100.0 /100 | #26 | Exceptional 2.7% |
| Immigrants | Turkey | 100.0 /100 | #27 | Exceptional 2.6% |
| Burmese | 100.0 /100 | #28 | Exceptional 2.6% |
| Immigrants | South Central Asia | 100.0 /100 | #29 | Exceptional 2.6% |
| Immigrants | Korea | 100.0 /100 | #30 | Exceptional 2.6% |
| Latvians | 100.0 /100 | #31 | Exceptional 2.6% |
| Immigrants | Northern Europe | 100.0 /100 | #32 | Exceptional 2.6% |
| Cambodians | 100.0 /100 | #33 | Exceptional 2.6% |
| Cypriots | 100.0 /100 | #34 | Exceptional 2.6% |
| Immigrants | Malaysia | 100.0 /100 | #35 | Exceptional 2.6% |