Immigrants from Ireland vs Venezuelan Professional Degree
COMPARE
Immigrants from Ireland
Venezuelan
Professional Degree
Professional Degree Comparison
Immigrants from Ireland
Venezuelans
6.3%
PROFESSIONAL DEGREE
100.0/ 100
METRIC RATING
25th/ 347
METRIC RANK
4.9%
PROFESSIONAL DEGREE
96.3/ 100
METRIC RATING
116th/ 347
METRIC RANK
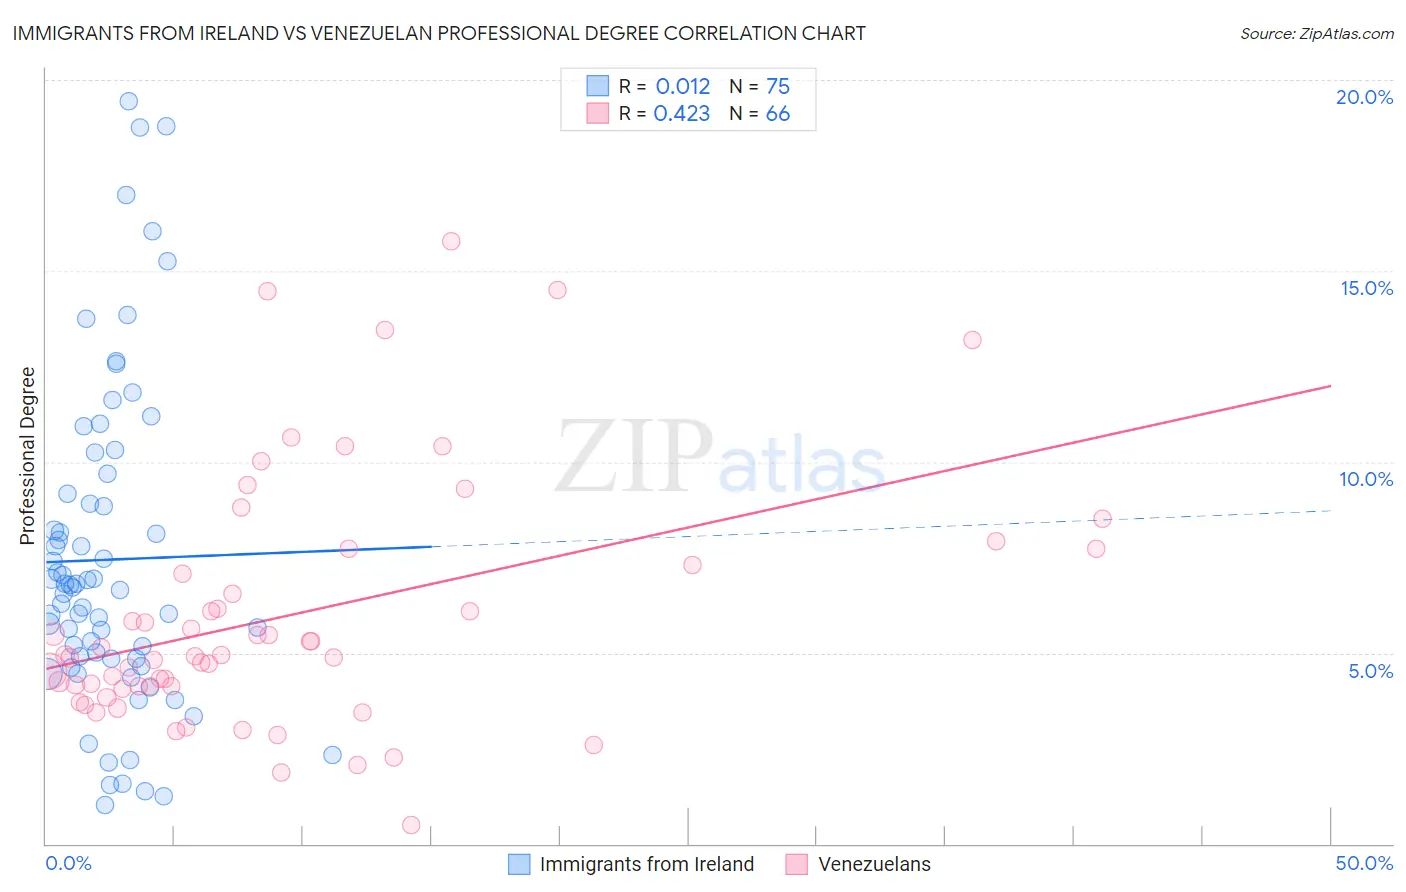
Immigrants from Ireland vs Venezuelan Professional Degree Correlation Chart
The statistical analysis conducted on geographies consisting of 240,598,418 people shows no correlation between the proportion of Immigrants from Ireland and percentage of population with at least professional degree education in the United States with a correlation coefficient (R) of 0.012 and weighted average of 6.3%. Similarly, the statistical analysis conducted on geographies consisting of 305,937,617 people shows a moderate positive correlation between the proportion of Venezuelans and percentage of population with at least professional degree education in the United States with a correlation coefficient (R) of 0.423 and weighted average of 4.9%, a difference of 27.9%.
Professional Degree Correlation Summary
| Measurement | Immigrants from Ireland | Venezuelan |
| Minimum | 1.0% | 0.50% |
| Maximum | 19.5% | 15.8% |
| Range | 18.4% | 15.3% |
| Mean | 7.4% | 6.0% |
| Median | 6.7% | 4.9% |
| Interquartile 25% (IQ1) | 4.9% | 4.1% |
| Interquartile 75% (IQ3) | 9.2% | 7.3% |
| Interquartile Range (IQR) | 4.3% | 3.2% |
| Standard Deviation (Sample) | 4.2% | 3.2% |
| Standard Deviation (Population) | 4.2% | 3.2% |
Similar Demographics by Professional Degree
Demographics Similar to Immigrants from Ireland by Professional Degree
In terms of professional degree, the demographic groups most similar to Immigrants from Ireland are Immigrants from Spain (6.3%, a difference of 0.49%), Russian (6.3%, a difference of 0.53%), Latvian (6.2%, a difference of 0.88%), Immigrants from Japan (6.4%, a difference of 1.0%), and Immigrants from Northern Europe (6.2%, a difference of 1.4%).
| Demographics | Rating | Rank | Professional Degree |
| Soviet Union | 100.0 /100 | #18 | Exceptional 6.6% |
| Indians (Asian) | 100.0 /100 | #19 | Exceptional 6.5% |
| Immigrants | Denmark | 100.0 /100 | #20 | Exceptional 6.4% |
| Immigrants | Hong Kong | 100.0 /100 | #21 | Exceptional 6.4% |
| Immigrants | Japan | 100.0 /100 | #22 | Exceptional 6.4% |
| Russians | 100.0 /100 | #23 | Exceptional 6.3% |
| Immigrants | Spain | 100.0 /100 | #24 | Exceptional 6.3% |
| Immigrants | Ireland | 100.0 /100 | #25 | Exceptional 6.3% |
| Latvians | 100.0 /100 | #26 | Exceptional 6.2% |
| Immigrants | Northern Europe | 100.0 /100 | #27 | Exceptional 6.2% |
| Turks | 100.0 /100 | #28 | Exceptional 6.2% |
| Immigrants | Sri Lanka | 100.0 /100 | #29 | Exceptional 6.2% |
| Immigrants | Turkey | 100.0 /100 | #30 | Exceptional 6.2% |
| Immigrants | India | 100.0 /100 | #31 | Exceptional 6.2% |
| Thais | 100.0 /100 | #32 | Exceptional 6.1% |
Demographics Similar to Venezuelans by Professional Degree
In terms of professional degree, the demographic groups most similar to Venezuelans are Immigrants from Syria (4.9%, a difference of 0.21%), Croatian (4.9%, a difference of 0.21%), Moroccan (5.0%, a difference of 0.47%), Immigrants from Morocco (5.0%, a difference of 0.57%), and Immigrants from Sudan (4.9%, a difference of 0.75%).
| Demographics | Rating | Rank | Professional Degree |
| British | 98.0 /100 | #109 | Exceptional 5.0% |
| Lebanese | 98.0 /100 | #110 | Exceptional 5.0% |
| Brazilians | 97.4 /100 | #111 | Exceptional 5.0% |
| Taiwanese | 97.3 /100 | #112 | Exceptional 5.0% |
| Immigrants | Pakistan | 97.2 /100 | #113 | Exceptional 5.0% |
| Immigrants | Morocco | 96.8 /100 | #114 | Exceptional 5.0% |
| Moroccans | 96.8 /100 | #115 | Exceptional 5.0% |
| Venezuelans | 96.3 /100 | #116 | Exceptional 4.9% |
| Immigrants | Syria | 96.0 /100 | #117 | Exceptional 4.9% |
| Croatians | 96.0 /100 | #118 | Exceptional 4.9% |
| Immigrants | Sudan | 95.4 /100 | #119 | Exceptional 4.9% |
| Albanians | 95.3 /100 | #120 | Exceptional 4.9% |
| Immigrants | Moldova | 94.8 /100 | #121 | Exceptional 4.9% |
| Immigrants | Germany | 94.1 /100 | #122 | Exceptional 4.9% |
| Immigrants | Venezuela | 93.8 /100 | #123 | Exceptional 4.8% |