Panamanian vs Venezuelan Professional Degree
COMPARE
Panamanian
Venezuelan
Professional Degree
Professional Degree Comparison
Panamanians
Venezuelans
4.1%
PROFESSIONAL DEGREE
15.9/ 100
METRIC RATING
203rd/ 347
METRIC RANK
4.9%
PROFESSIONAL DEGREE
96.3/ 100
METRIC RATING
116th/ 347
METRIC RANK
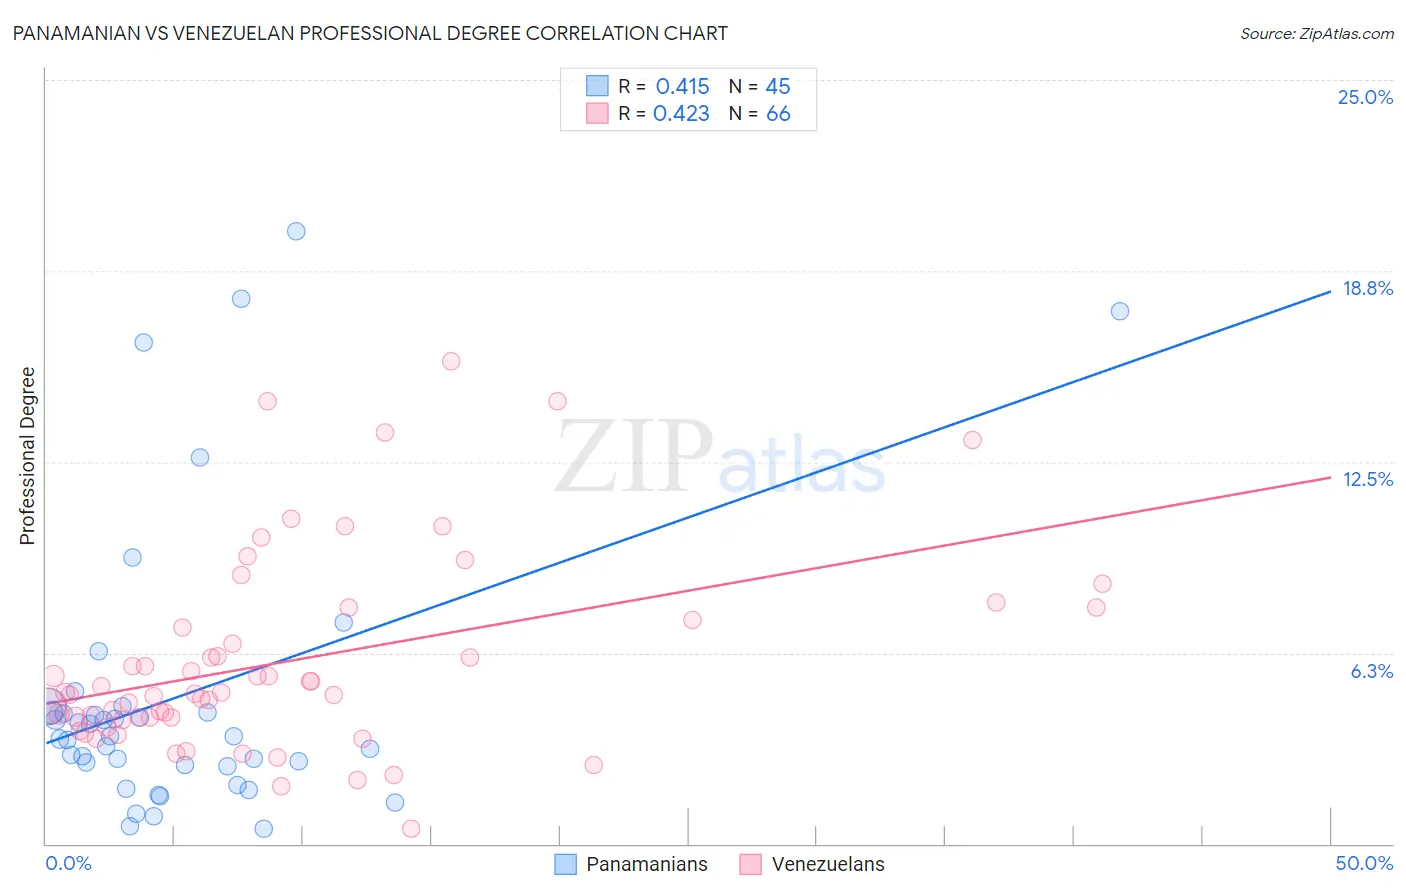
Panamanian vs Venezuelan Professional Degree Correlation Chart
The statistical analysis conducted on geographies consisting of 280,833,474 people shows a moderate positive correlation between the proportion of Panamanians and percentage of population with at least professional degree education in the United States with a correlation coefficient (R) of 0.415 and weighted average of 4.1%. Similarly, the statistical analysis conducted on geographies consisting of 305,937,617 people shows a moderate positive correlation between the proportion of Venezuelans and percentage of population with at least professional degree education in the United States with a correlation coefficient (R) of 0.423 and weighted average of 4.9%, a difference of 19.0%.
Professional Degree Correlation Summary
| Measurement | Panamanian | Venezuelan |
| Minimum | 0.49% | 0.50% |
| Maximum | 20.0% | 15.8% |
| Range | 19.6% | 15.3% |
| Mean | 4.8% | 6.0% |
| Median | 3.5% | 4.9% |
| Interquartile 25% (IQ1) | 2.6% | 4.1% |
| Interquartile 75% (IQ3) | 4.4% | 7.3% |
| Interquartile Range (IQR) | 1.8% | 3.2% |
| Standard Deviation (Sample) | 4.7% | 3.2% |
| Standard Deviation (Population) | 4.6% | 3.2% |
Similar Demographics by Professional Degree
Demographics Similar to Panamanians by Professional Degree
In terms of professional degree, the demographic groups most similar to Panamanians are Barbadian (4.1%, a difference of 0.030%), Immigrants from Iraq (4.2%, a difference of 0.33%), Somali (4.1%, a difference of 0.35%), Finnish (4.2%, a difference of 0.76%), and Yugoslavian (4.1%, a difference of 0.78%).
| Demographics | Rating | Rank | Professional Degree |
| Spanish | 23.0 /100 | #196 | Fair 4.2% |
| Czechoslovakians | 22.4 /100 | #197 | Fair 4.2% |
| Immigrants | Middle Africa | 22.1 /100 | #198 | Fair 4.2% |
| Norwegians | 20.5 /100 | #199 | Fair 4.2% |
| Immigrants | North Macedonia | 20.2 /100 | #200 | Fair 4.2% |
| Finns | 18.7 /100 | #201 | Poor 4.2% |
| Immigrants | Iraq | 17.1 /100 | #202 | Poor 4.2% |
| Panamanians | 15.9 /100 | #203 | Poor 4.1% |
| Barbadians | 15.8 /100 | #204 | Poor 4.1% |
| Somalis | 14.8 /100 | #205 | Poor 4.1% |
| Yugoslavians | 13.4 /100 | #206 | Poor 4.1% |
| Sub-Saharan Africans | 12.8 /100 | #207 | Poor 4.1% |
| Immigrants | Somalia | 12.5 /100 | #208 | Poor 4.1% |
| Immigrants | Panama | 12.3 /100 | #209 | Poor 4.1% |
| Immigrants | Nigeria | 11.7 /100 | #210 | Poor 4.1% |
Demographics Similar to Venezuelans by Professional Degree
In terms of professional degree, the demographic groups most similar to Venezuelans are Immigrants from Syria (4.9%, a difference of 0.21%), Croatian (4.9%, a difference of 0.21%), Moroccan (5.0%, a difference of 0.47%), Immigrants from Morocco (5.0%, a difference of 0.57%), and Immigrants from Sudan (4.9%, a difference of 0.75%).
| Demographics | Rating | Rank | Professional Degree |
| British | 98.0 /100 | #109 | Exceptional 5.0% |
| Lebanese | 98.0 /100 | #110 | Exceptional 5.0% |
| Brazilians | 97.4 /100 | #111 | Exceptional 5.0% |
| Taiwanese | 97.3 /100 | #112 | Exceptional 5.0% |
| Immigrants | Pakistan | 97.2 /100 | #113 | Exceptional 5.0% |
| Immigrants | Morocco | 96.8 /100 | #114 | Exceptional 5.0% |
| Moroccans | 96.8 /100 | #115 | Exceptional 5.0% |
| Venezuelans | 96.3 /100 | #116 | Exceptional 4.9% |
| Immigrants | Syria | 96.0 /100 | #117 | Exceptional 4.9% |
| Croatians | 96.0 /100 | #118 | Exceptional 4.9% |
| Immigrants | Sudan | 95.4 /100 | #119 | Exceptional 4.9% |
| Albanians | 95.3 /100 | #120 | Exceptional 4.9% |
| Immigrants | Moldova | 94.8 /100 | #121 | Exceptional 4.9% |
| Immigrants | Germany | 94.1 /100 | #122 | Exceptional 4.9% |
| Immigrants | Venezuela | 93.8 /100 | #123 | Exceptional 4.8% |