Alaska Native vs Venezuelan Professional Degree
COMPARE
Alaska Native
Venezuelan
Professional Degree
Professional Degree Comparison
Alaska Natives
Venezuelans
3.5%
PROFESSIONAL DEGREE
0.3/ 100
METRIC RATING
291st/ 347
METRIC RANK
4.9%
PROFESSIONAL DEGREE
96.3/ 100
METRIC RATING
116th/ 347
METRIC RANK
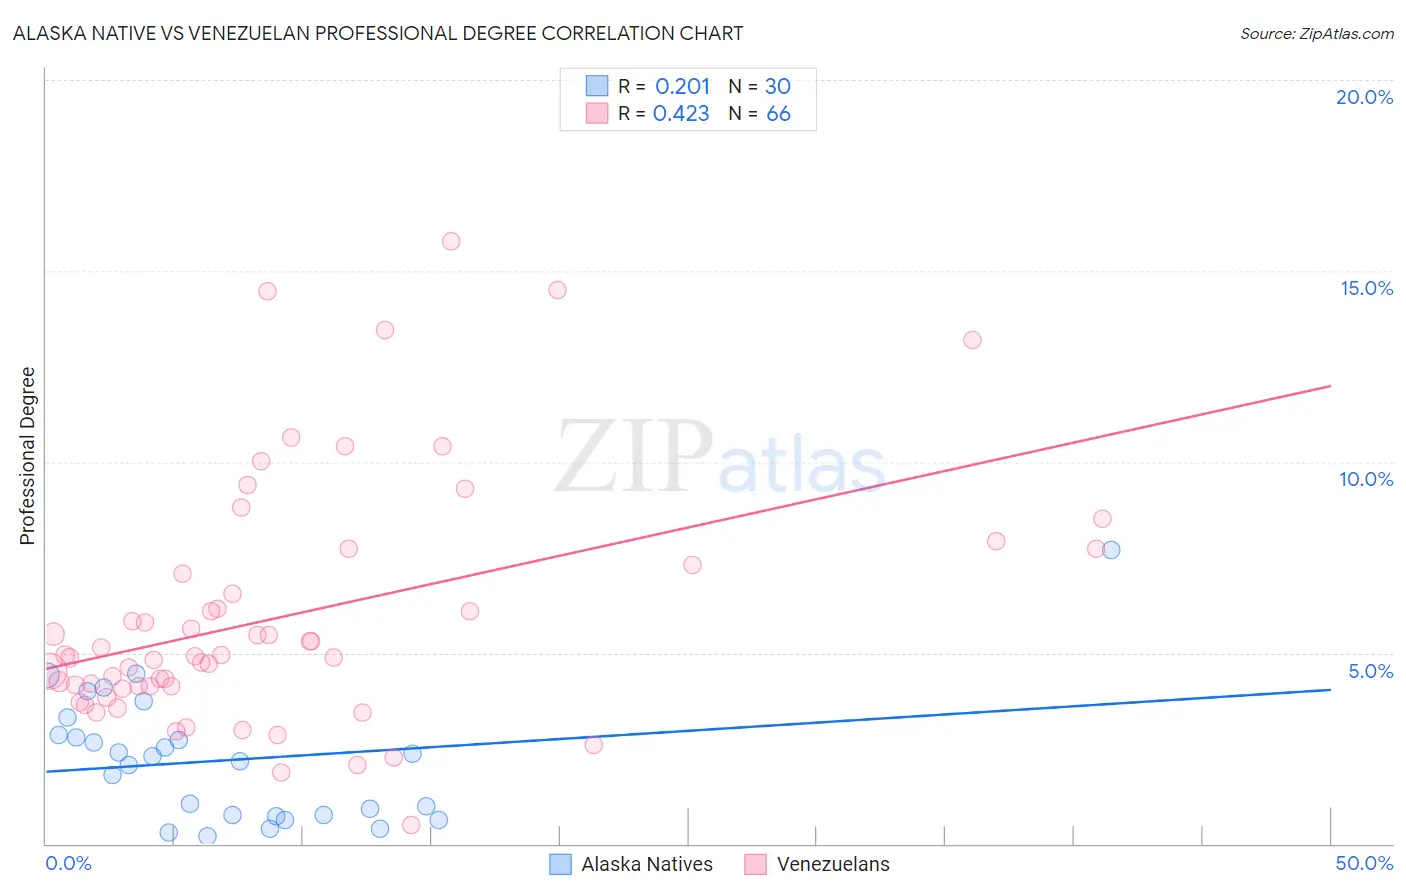
Alaska Native vs Venezuelan Professional Degree Correlation Chart
The statistical analysis conducted on geographies consisting of 76,648,508 people shows a weak positive correlation between the proportion of Alaska Natives and percentage of population with at least professional degree education in the United States with a correlation coefficient (R) of 0.201 and weighted average of 3.5%. Similarly, the statistical analysis conducted on geographies consisting of 305,937,617 people shows a moderate positive correlation between the proportion of Venezuelans and percentage of population with at least professional degree education in the United States with a correlation coefficient (R) of 0.423 and weighted average of 4.9%, a difference of 42.3%.
Professional Degree Correlation Summary
| Measurement | Alaska Native | Venezuelan |
| Minimum | 0.21% | 0.50% |
| Maximum | 7.7% | 15.8% |
| Range | 7.5% | 15.3% |
| Mean | 2.2% | 6.0% |
| Median | 2.2% | 4.9% |
| Interquartile 25% (IQ1) | 0.74% | 4.1% |
| Interquartile 75% (IQ3) | 2.9% | 7.3% |
| Interquartile Range (IQR) | 2.1% | 3.2% |
| Standard Deviation (Sample) | 1.7% | 3.2% |
| Standard Deviation (Population) | 1.7% | 3.2% |
Similar Demographics by Professional Degree
Demographics Similar to Alaska Natives by Professional Degree
In terms of professional degree, the demographic groups most similar to Alaska Natives are Immigrants from Belize (3.5%, a difference of 0.070%), Chippewa (3.5%, a difference of 0.17%), Guatemalan (3.5%, a difference of 0.18%), Immigrants from Honduras (3.5%, a difference of 0.30%), and Blackfeet (3.5%, a difference of 0.36%).
| Demographics | Rating | Rank | Professional Degree |
| Salvadorans | 0.4 /100 | #284 | Tragic 3.5% |
| Hondurans | 0.3 /100 | #285 | Tragic 3.5% |
| Haitians | 0.3 /100 | #286 | Tragic 3.5% |
| Immigrants | El Salvador | 0.3 /100 | #287 | Tragic 3.5% |
| Blackfeet | 0.3 /100 | #288 | Tragic 3.5% |
| Guatemalans | 0.3 /100 | #289 | Tragic 3.5% |
| Chippewa | 0.3 /100 | #290 | Tragic 3.5% |
| Alaska Natives | 0.3 /100 | #291 | Tragic 3.5% |
| Immigrants | Belize | 0.3 /100 | #292 | Tragic 3.5% |
| Immigrants | Honduras | 0.3 /100 | #293 | Tragic 3.5% |
| Paiute | 0.3 /100 | #294 | Tragic 3.4% |
| Immigrants | Guatemala | 0.2 /100 | #295 | Tragic 3.4% |
| Hawaiians | 0.2 /100 | #296 | Tragic 3.4% |
| Immigrants | Liberia | 0.2 /100 | #297 | Tragic 3.4% |
| Ottawa | 0.2 /100 | #298 | Tragic 3.4% |
Demographics Similar to Venezuelans by Professional Degree
In terms of professional degree, the demographic groups most similar to Venezuelans are Immigrants from Syria (4.9%, a difference of 0.21%), Croatian (4.9%, a difference of 0.21%), Moroccan (5.0%, a difference of 0.47%), Immigrants from Morocco (5.0%, a difference of 0.57%), and Immigrants from Sudan (4.9%, a difference of 0.75%).
| Demographics | Rating | Rank | Professional Degree |
| British | 98.0 /100 | #109 | Exceptional 5.0% |
| Lebanese | 98.0 /100 | #110 | Exceptional 5.0% |
| Brazilians | 97.4 /100 | #111 | Exceptional 5.0% |
| Taiwanese | 97.3 /100 | #112 | Exceptional 5.0% |
| Immigrants | Pakistan | 97.2 /100 | #113 | Exceptional 5.0% |
| Immigrants | Morocco | 96.8 /100 | #114 | Exceptional 5.0% |
| Moroccans | 96.8 /100 | #115 | Exceptional 5.0% |
| Venezuelans | 96.3 /100 | #116 | Exceptional 4.9% |
| Immigrants | Syria | 96.0 /100 | #117 | Exceptional 4.9% |
| Croatians | 96.0 /100 | #118 | Exceptional 4.9% |
| Immigrants | Sudan | 95.4 /100 | #119 | Exceptional 4.9% |
| Albanians | 95.3 /100 | #120 | Exceptional 4.9% |
| Immigrants | Moldova | 94.8 /100 | #121 | Exceptional 4.9% |
| Immigrants | Germany | 94.1 /100 | #122 | Exceptional 4.9% |
| Immigrants | Venezuela | 93.8 /100 | #123 | Exceptional 4.8% |