Liberian vs Russian Single Father Households
COMPARE
Liberian
Russian
Single Father Households
Single Father Households Comparison
Liberians
Russians
2.5%
SINGLE FATHER HOUSEHOLDS
2.0/ 100
METRIC RATING
251st/ 347
METRIC RANK
2.0%
SINGLE FATHER HOUSEHOLDS
100.0/ 100
METRIC RATING
45th/ 347
METRIC RANK
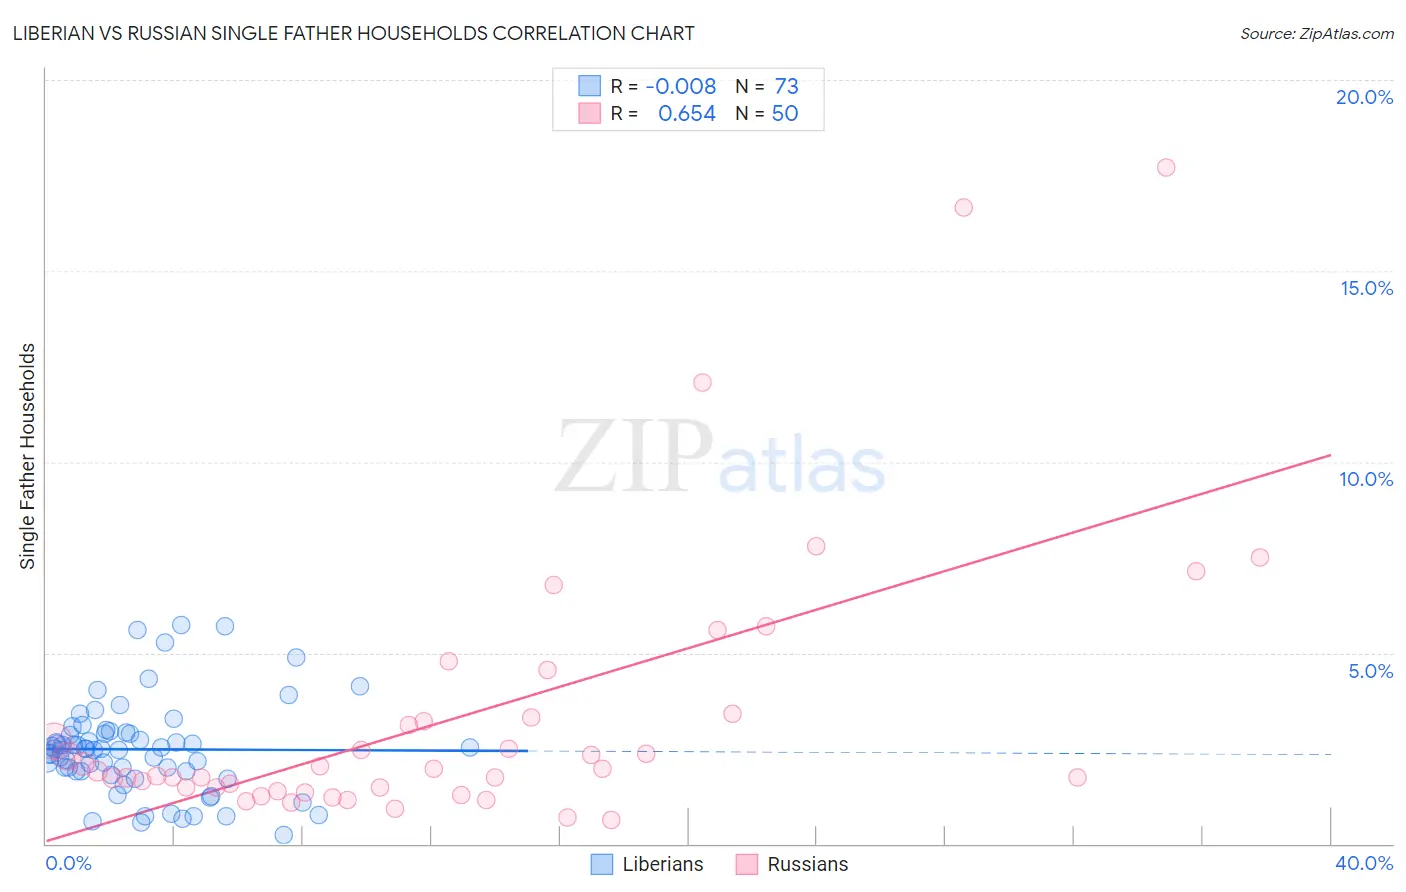
Liberian vs Russian Single Father Households Correlation Chart
The statistical analysis conducted on geographies consisting of 117,831,420 people shows no correlation between the proportion of Liberians and percentage of single father households in the United States with a correlation coefficient (R) of -0.008 and weighted average of 2.5%. Similarly, the statistical analysis conducted on geographies consisting of 503,310,659 people shows a significant positive correlation between the proportion of Russians and percentage of single father households in the United States with a correlation coefficient (R) of 0.654 and weighted average of 2.0%, a difference of 24.9%.
Single Father Households Correlation Summary
| Measurement | Liberian | Russian |
| Minimum | 0.24% | 0.62% |
| Maximum | 5.7% | 17.7% |
| Range | 5.5% | 17.1% |
| Mean | 2.5% | 3.3% |
| Median | 2.5% | 1.9% |
| Interquartile 25% (IQ1) | 1.9% | 1.5% |
| Interquartile 75% (IQ3) | 2.9% | 3.3% |
| Interquartile Range (IQR) | 0.99% | 1.8% |
| Standard Deviation (Sample) | 1.2% | 3.6% |
| Standard Deviation (Population) | 1.2% | 3.6% |
Similar Demographics by Single Father Households
Demographics Similar to Liberians by Single Father Households
In terms of single father households, the demographic groups most similar to Liberians are Immigrants from Eritrea (2.5%, a difference of 0.020%), Somali (2.5%, a difference of 0.090%), Immigrants from Somalia (2.5%, a difference of 0.090%), Immigrants from Thailand (2.5%, a difference of 0.13%), and Immigrants from Cameroon (2.5%, a difference of 0.26%).
| Demographics | Rating | Rank | Single Father Households |
| Immigrants | Middle Africa | 2.8 /100 | #244 | Tragic 2.5% |
| Basques | 2.5 /100 | #245 | Tragic 2.5% |
| Native Hawaiians | 2.5 /100 | #246 | Tragic 2.5% |
| Delaware | 2.5 /100 | #247 | Tragic 2.5% |
| Bahamians | 2.4 /100 | #248 | Tragic 2.5% |
| Immigrants | Cameroon | 2.3 /100 | #249 | Tragic 2.5% |
| Somalis | 2.1 /100 | #250 | Tragic 2.5% |
| Liberians | 2.0 /100 | #251 | Tragic 2.5% |
| Immigrants | Eritrea | 2.0 /100 | #252 | Tragic 2.5% |
| Immigrants | Somalia | 1.9 /100 | #253 | Tragic 2.5% |
| Immigrants | Thailand | 1.8 /100 | #254 | Tragic 2.5% |
| Tongans | 1.5 /100 | #255 | Tragic 2.5% |
| Potawatomi | 1.4 /100 | #256 | Tragic 2.5% |
| Immigrants | Congo | 1.2 /100 | #257 | Tragic 2.5% |
| Spanish | 1.1 /100 | #258 | Tragic 2.5% |
Demographics Similar to Russians by Single Father Households
In terms of single father households, the demographic groups most similar to Russians are Latvian (2.0%, a difference of 0.020%), Immigrants from Grenada (2.0%, a difference of 0.10%), Immigrants from Lebanon (2.0%, a difference of 0.10%), Macedonian (2.0%, a difference of 0.33%), and Immigrants from Ukraine (2.0%, a difference of 0.46%).
| Demographics | Rating | Rank | Single Father Households |
| Immigrants | Eastern Europe | 100.0 /100 | #38 | Exceptional 2.0% |
| Immigrants | Sri Lanka | 100.0 /100 | #39 | Exceptional 2.0% |
| Immigrants | Bulgaria | 100.0 /100 | #40 | Exceptional 2.0% |
| Immigrants | Turkey | 100.0 /100 | #41 | Exceptional 2.0% |
| Macedonians | 100.0 /100 | #42 | Exceptional 2.0% |
| Immigrants | Grenada | 100.0 /100 | #43 | Exceptional 2.0% |
| Latvians | 100.0 /100 | #44 | Exceptional 2.0% |
| Russians | 100.0 /100 | #45 | Exceptional 2.0% |
| Immigrants | Lebanon | 100.0 /100 | #46 | Exceptional 2.0% |
| Immigrants | Ukraine | 99.9 /100 | #47 | Exceptional 2.0% |
| Immigrants | Kazakhstan | 99.9 /100 | #48 | Exceptional 2.0% |
| Immigrants | Serbia | 99.9 /100 | #49 | Exceptional 2.0% |
| Immigrants | Switzerland | 99.9 /100 | #50 | Exceptional 2.0% |
| Immigrants | Poland | 99.9 /100 | #51 | Exceptional 2.0% |
| Immigrants | Europe | 99.9 /100 | #52 | Exceptional 2.0% |