Liberian vs Egyptian No Schooling Completed
COMPARE
Liberian
Egyptian
No Schooling Completed
No Schooling Completed Comparison
Liberians
Egyptians
2.4%
NO SCHOOLING COMPLETED
1.8/ 100
METRIC RATING
239th/ 347
METRIC RANK
2.1%
NO SCHOOLING COMPLETED
59.2/ 100
METRIC RATING
167th/ 347
METRIC RANK
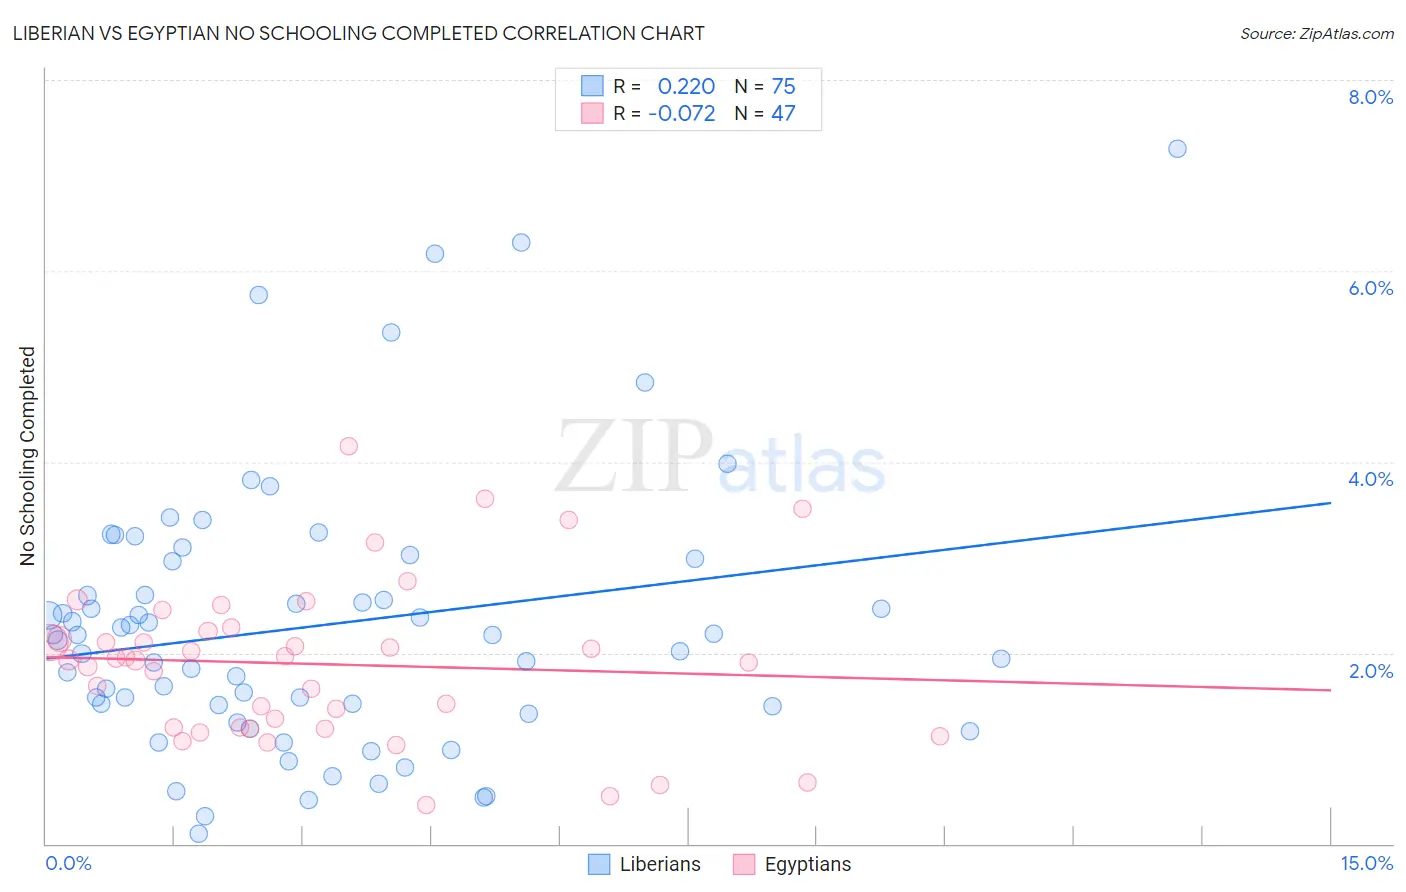
Liberian vs Egyptian No Schooling Completed Correlation Chart
The statistical analysis conducted on geographies consisting of 117,885,030 people shows a weak positive correlation between the proportion of Liberians and percentage of population with no schooling in the United States with a correlation coefficient (R) of 0.220 and weighted average of 2.4%. Similarly, the statistical analysis conducted on geographies consisting of 275,573,991 people shows a slight negative correlation between the proportion of Egyptians and percentage of population with no schooling in the United States with a correlation coefficient (R) of -0.072 and weighted average of 2.1%, a difference of 14.8%.
No Schooling Completed Correlation Summary
| Measurement | Liberian | Egyptian |
| Minimum | 0.10% | 0.40% |
| Maximum | 7.3% | 4.2% |
| Range | 7.2% | 3.8% |
| Mean | 2.3% | 1.9% |
| Median | 2.2% | 1.9% |
| Interquartile 25% (IQ1) | 1.4% | 1.2% |
| Interquartile 75% (IQ3) | 3.0% | 2.2% |
| Interquartile Range (IQR) | 1.5% | 1.0% |
| Standard Deviation (Sample) | 1.4% | 0.82% |
| Standard Deviation (Population) | 1.4% | 0.81% |
Similar Demographics by No Schooling Completed
Demographics Similar to Liberians by No Schooling Completed
In terms of no schooling completed, the demographic groups most similar to Liberians are Paiute (2.4%, a difference of 0.12%), Immigrants from Senegal (2.4%, a difference of 0.23%), Korean (2.4%, a difference of 0.29%), Immigrants from Eastern Asia (2.4%, a difference of 0.33%), and Iraqi (2.4%, a difference of 0.53%).
| Demographics | Rating | Rank | No Schooling Completed |
| Colombians | 3.2 /100 | #232 | Tragic 2.3% |
| Immigrants | Malaysia | 2.8 /100 | #233 | Tragic 2.3% |
| Nigerians | 2.6 /100 | #234 | Tragic 2.3% |
| Immigrants | Western Asia | 2.6 /100 | #235 | Tragic 2.3% |
| Iraqis | 2.2 /100 | #236 | Tragic 2.4% |
| Immigrants | Eastern Asia | 2.0 /100 | #237 | Tragic 2.4% |
| Paiute | 1.9 /100 | #238 | Tragic 2.4% |
| Liberians | 1.8 /100 | #239 | Tragic 2.4% |
| Immigrants | Senegal | 1.7 /100 | #240 | Tragic 2.4% |
| Koreans | 1.7 /100 | #241 | Tragic 2.4% |
| Immigrants | Indonesia | 1.5 /100 | #242 | Tragic 2.4% |
| South Americans | 1.5 /100 | #243 | Tragic 2.4% |
| Peruvians | 1.4 /100 | #244 | Tragic 2.4% |
| Bolivians | 1.4 /100 | #245 | Tragic 2.4% |
| Immigrants | Congo | 1.4 /100 | #246 | Tragic 2.4% |
Demographics Similar to Egyptians by No Schooling Completed
In terms of no schooling completed, the demographic groups most similar to Egyptians are Cheyenne (2.1%, a difference of 0.080%), Dutch West Indian (2.1%, a difference of 0.10%), Brazilian (2.1%, a difference of 0.15%), Comanche (2.1%, a difference of 0.21%), and Apache (2.1%, a difference of 0.35%).
| Demographics | Rating | Rank | No Schooling Completed |
| Kenyans | 65.7 /100 | #160 | Good 2.0% |
| Ugandans | 64.6 /100 | #161 | Good 2.0% |
| Immigrants | Brazil | 63.8 /100 | #162 | Good 2.1% |
| Albanians | 62.2 /100 | #163 | Good 2.1% |
| Comanche | 60.7 /100 | #164 | Good 2.1% |
| Brazilians | 60.2 /100 | #165 | Good 2.1% |
| Dutch West Indians | 59.9 /100 | #166 | Average 2.1% |
| Egyptians | 59.2 /100 | #167 | Average 2.1% |
| Cheyenne | 58.6 /100 | #168 | Average 2.1% |
| Apache | 56.7 /100 | #169 | Average 2.1% |
| Argentineans | 56.0 /100 | #170 | Average 2.1% |
| Immigrants | Poland | 55.2 /100 | #171 | Average 2.1% |
| Immigrants | Argentina | 52.7 /100 | #172 | Average 2.1% |
| Immigrants | Belarus | 51.8 /100 | #173 | Average 2.1% |
| Immigrants | Micronesia | 50.0 /100 | #174 | Average 2.1% |