Liberian vs Immigrants from Europe No Schooling Completed
COMPARE
Liberian
Immigrants from Europe
No Schooling Completed
No Schooling Completed Comparison
Liberians
Immigrants from Europe
2.4%
NO SCHOOLING COMPLETED
1.8/ 100
METRIC RATING
239th/ 347
METRIC RANK
1.9%
NO SCHOOLING COMPLETED
93.7/ 100
METRIC RATING
125th/ 347
METRIC RANK
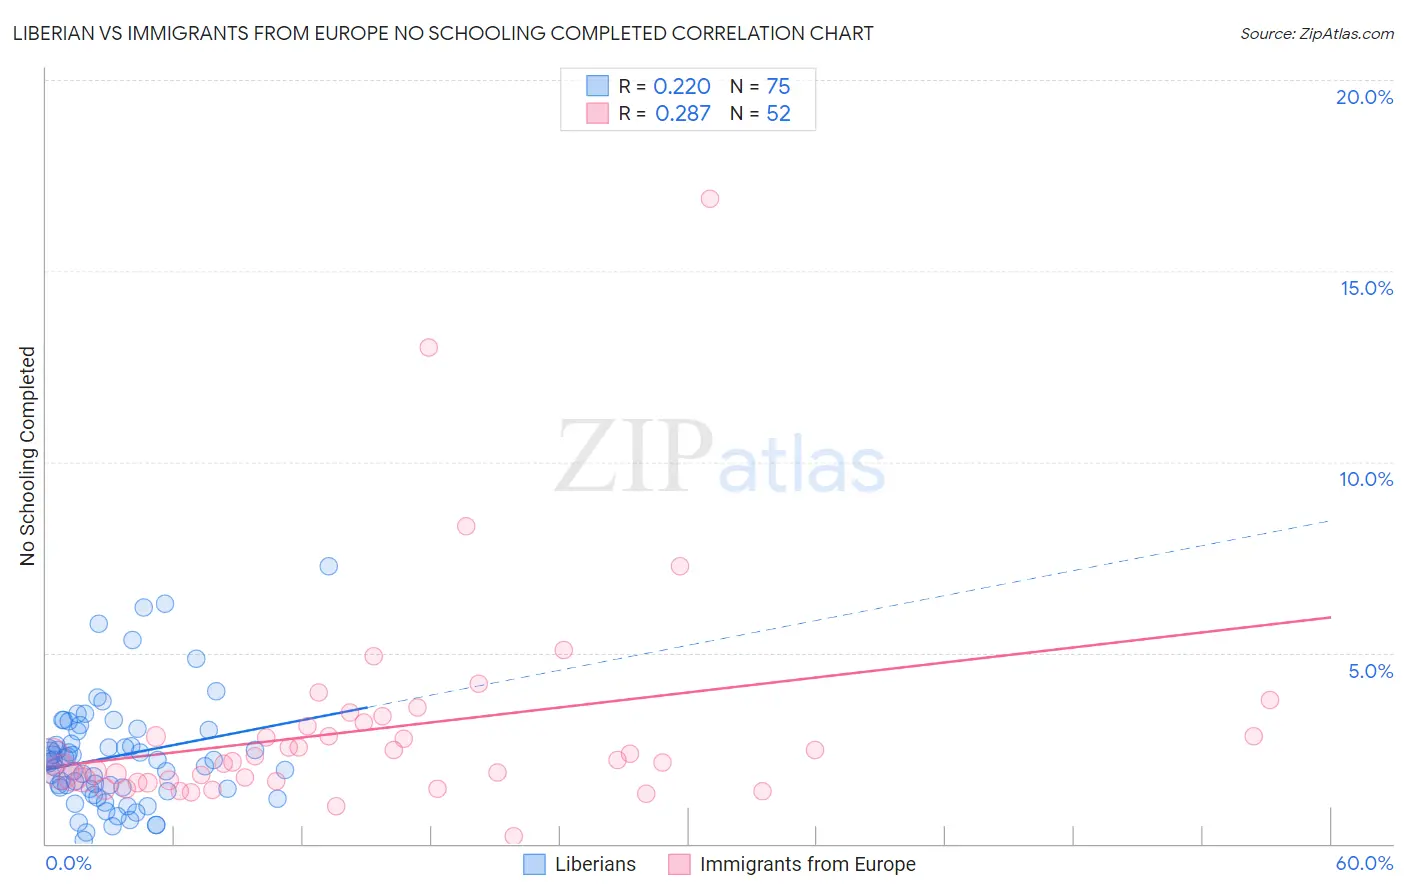
Liberian vs Immigrants from Europe No Schooling Completed Correlation Chart
The statistical analysis conducted on geographies consisting of 117,885,030 people shows a weak positive correlation between the proportion of Liberians and percentage of population with no schooling in the United States with a correlation coefficient (R) of 0.220 and weighted average of 2.4%. Similarly, the statistical analysis conducted on geographies consisting of 533,582,074 people shows a weak positive correlation between the proportion of Immigrants from Europe and percentage of population with no schooling in the United States with a correlation coefficient (R) of 0.287 and weighted average of 1.9%, a difference of 24.6%.
No Schooling Completed Correlation Summary
| Measurement | Liberian | Immigrants from Europe |
| Minimum | 0.10% | 0.21% |
| Maximum | 7.3% | 16.9% |
| Range | 7.2% | 16.7% |
| Mean | 2.3% | 3.0% |
| Median | 2.2% | 2.2% |
| Interquartile 25% (IQ1) | 1.4% | 1.6% |
| Interquartile 75% (IQ3) | 3.0% | 3.1% |
| Interquartile Range (IQR) | 1.5% | 1.5% |
| Standard Deviation (Sample) | 1.4% | 2.8% |
| Standard Deviation (Population) | 1.4% | 2.8% |
Similar Demographics by No Schooling Completed
Demographics Similar to Liberians by No Schooling Completed
In terms of no schooling completed, the demographic groups most similar to Liberians are Paiute (2.4%, a difference of 0.12%), Immigrants from Senegal (2.4%, a difference of 0.23%), Korean (2.4%, a difference of 0.29%), Immigrants from Eastern Asia (2.4%, a difference of 0.33%), and Iraqi (2.4%, a difference of 0.53%).
| Demographics | Rating | Rank | No Schooling Completed |
| Colombians | 3.2 /100 | #232 | Tragic 2.3% |
| Immigrants | Malaysia | 2.8 /100 | #233 | Tragic 2.3% |
| Nigerians | 2.6 /100 | #234 | Tragic 2.3% |
| Immigrants | Western Asia | 2.6 /100 | #235 | Tragic 2.3% |
| Iraqis | 2.2 /100 | #236 | Tragic 2.4% |
| Immigrants | Eastern Asia | 2.0 /100 | #237 | Tragic 2.4% |
| Paiute | 1.9 /100 | #238 | Tragic 2.4% |
| Liberians | 1.8 /100 | #239 | Tragic 2.4% |
| Immigrants | Senegal | 1.7 /100 | #240 | Tragic 2.4% |
| Koreans | 1.7 /100 | #241 | Tragic 2.4% |
| Immigrants | Indonesia | 1.5 /100 | #242 | Tragic 2.4% |
| South Americans | 1.5 /100 | #243 | Tragic 2.4% |
| Peruvians | 1.4 /100 | #244 | Tragic 2.4% |
| Bolivians | 1.4 /100 | #245 | Tragic 2.4% |
| Immigrants | Congo | 1.4 /100 | #246 | Tragic 2.4% |
Demographics Similar to Immigrants from Europe by No Schooling Completed
In terms of no schooling completed, the demographic groups most similar to Immigrants from Europe are Cambodian (1.9%, a difference of 0.090%), Immigrants from Kuwait (1.9%, a difference of 0.17%), Cree (1.9%, a difference of 0.53%), Immigrants from Croatia (1.9%, a difference of 0.56%), and Immigrants from Bulgaria (1.9%, a difference of 0.63%).
| Demographics | Rating | Rank | No Schooling Completed |
| Spanish | 95.5 /100 | #118 | Exceptional 1.9% |
| Iroquois | 95.1 /100 | #119 | Exceptional 1.9% |
| Immigrants | Bulgaria | 94.6 /100 | #120 | Exceptional 1.9% |
| Immigrants | Croatia | 94.5 /100 | #121 | Exceptional 1.9% |
| Cree | 94.5 /100 | #122 | Exceptional 1.9% |
| Immigrants | Kuwait | 93.9 /100 | #123 | Exceptional 1.9% |
| Cambodians | 93.8 /100 | #124 | Exceptional 1.9% |
| Immigrants | Europe | 93.7 /100 | #125 | Exceptional 1.9% |
| Immigrants | Romania | 92.6 /100 | #126 | Exceptional 1.9% |
| Israelis | 92.4 /100 | #127 | Exceptional 1.9% |
| Spaniards | 92.3 /100 | #128 | Exceptional 1.9% |
| Seminole | 92.0 /100 | #129 | Exceptional 1.9% |
| Palestinians | 91.8 /100 | #130 | Exceptional 1.9% |
| Immigrants | Hungary | 91.6 /100 | #131 | Exceptional 1.9% |
| Colville | 90.4 /100 | #132 | Exceptional 1.9% |