Liberian vs Native Hawaiian No Schooling Completed
COMPARE
Liberian
Native Hawaiian
No Schooling Completed
No Schooling Completed Comparison
Liberians
Native Hawaiians
2.4%
NO SCHOOLING COMPLETED
1.8/ 100
METRIC RATING
239th/ 347
METRIC RANK
1.6%
NO SCHOOLING COMPLETED
99.9/ 100
METRIC RATING
39th/ 347
METRIC RANK
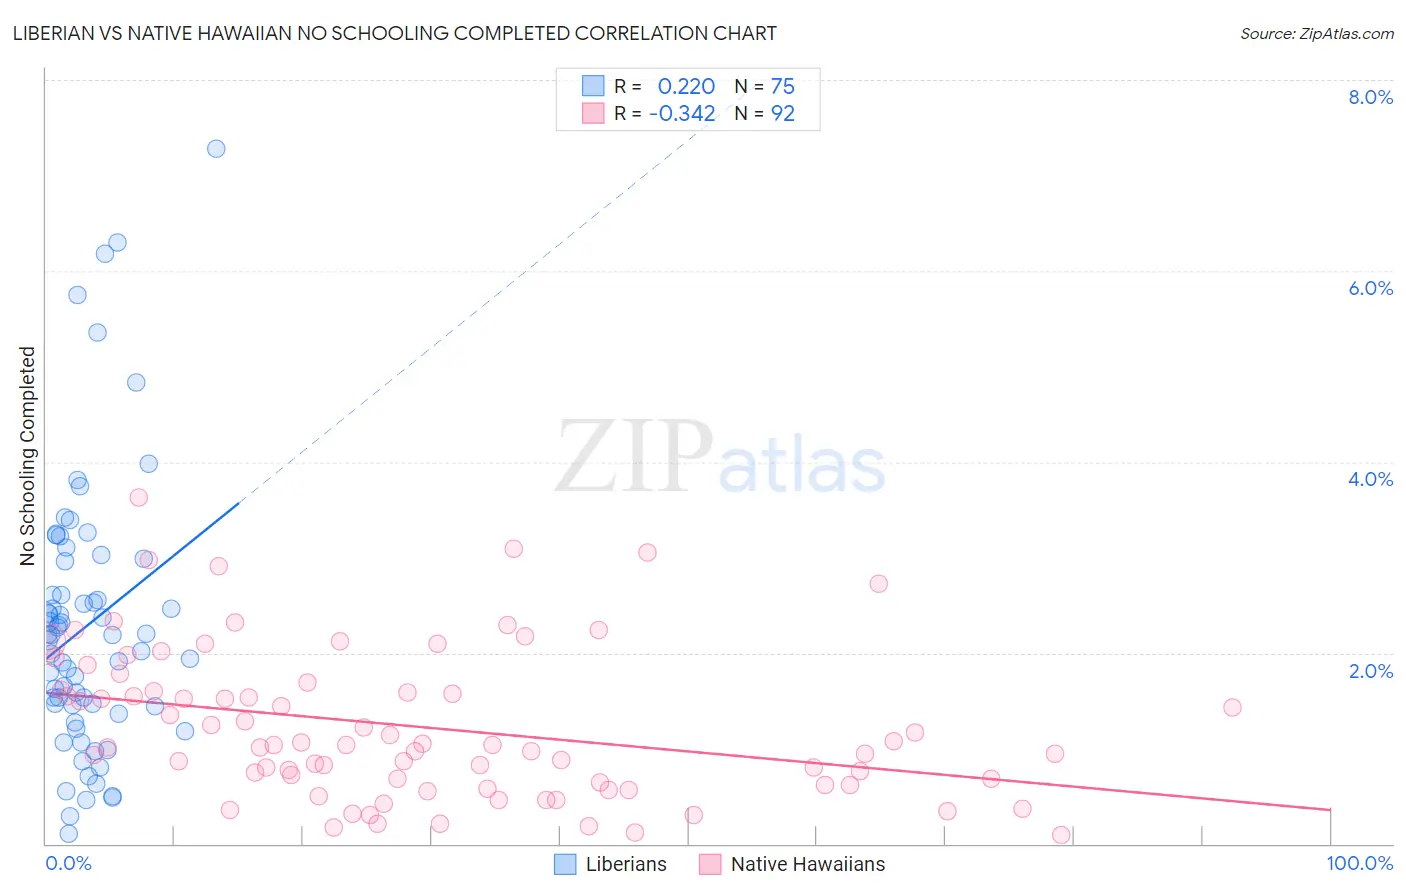
Liberian vs Native Hawaiian No Schooling Completed Correlation Chart
The statistical analysis conducted on geographies consisting of 117,885,030 people shows a weak positive correlation between the proportion of Liberians and percentage of population with no schooling in the United States with a correlation coefficient (R) of 0.220 and weighted average of 2.4%. Similarly, the statistical analysis conducted on geographies consisting of 328,857,957 people shows a mild negative correlation between the proportion of Native Hawaiians and percentage of population with no schooling in the United States with a correlation coefficient (R) of -0.342 and weighted average of 1.6%, a difference of 49.8%.
No Schooling Completed Correlation Summary
| Measurement | Liberian | Native Hawaiian |
| Minimum | 0.10% | 0.093% |
| Maximum | 7.3% | 3.6% |
| Range | 7.2% | 3.5% |
| Mean | 2.3% | 1.2% |
| Median | 2.2% | 1.0% |
| Interquartile 25% (IQ1) | 1.4% | 0.63% |
| Interquartile 75% (IQ3) | 3.0% | 1.6% |
| Interquartile Range (IQR) | 1.5% | 0.97% |
| Standard Deviation (Sample) | 1.4% | 0.78% |
| Standard Deviation (Population) | 1.4% | 0.77% |
Similar Demographics by No Schooling Completed
Demographics Similar to Liberians by No Schooling Completed
In terms of no schooling completed, the demographic groups most similar to Liberians are Paiute (2.4%, a difference of 0.12%), Immigrants from Senegal (2.4%, a difference of 0.23%), Korean (2.4%, a difference of 0.29%), Immigrants from Eastern Asia (2.4%, a difference of 0.33%), and Iraqi (2.4%, a difference of 0.53%).
| Demographics | Rating | Rank | No Schooling Completed |
| Colombians | 3.2 /100 | #232 | Tragic 2.3% |
| Immigrants | Malaysia | 2.8 /100 | #233 | Tragic 2.3% |
| Nigerians | 2.6 /100 | #234 | Tragic 2.3% |
| Immigrants | Western Asia | 2.6 /100 | #235 | Tragic 2.3% |
| Iraqis | 2.2 /100 | #236 | Tragic 2.4% |
| Immigrants | Eastern Asia | 2.0 /100 | #237 | Tragic 2.4% |
| Paiute | 1.9 /100 | #238 | Tragic 2.4% |
| Liberians | 1.8 /100 | #239 | Tragic 2.4% |
| Immigrants | Senegal | 1.7 /100 | #240 | Tragic 2.4% |
| Koreans | 1.7 /100 | #241 | Tragic 2.4% |
| Immigrants | Indonesia | 1.5 /100 | #242 | Tragic 2.4% |
| South Americans | 1.5 /100 | #243 | Tragic 2.4% |
| Peruvians | 1.4 /100 | #244 | Tragic 2.4% |
| Bolivians | 1.4 /100 | #245 | Tragic 2.4% |
| Immigrants | Congo | 1.4 /100 | #246 | Tragic 2.4% |
Demographics Similar to Native Hawaiians by No Schooling Completed
In terms of no schooling completed, the demographic groups most similar to Native Hawaiians are Northern European (1.6%, a difference of 0.27%), Luxembourger (1.6%, a difference of 0.35%), Belgian (1.6%, a difference of 0.40%), Hungarian (1.6%, a difference of 0.62%), and Aleut (1.6%, a difference of 0.67%).
| Demographics | Rating | Rank | No Schooling Completed |
| Swiss | 100.0 /100 | #32 | Exceptional 1.5% |
| Italians | 100.0 /100 | #33 | Exceptional 1.5% |
| Latvians | 100.0 /100 | #34 | Exceptional 1.5% |
| Eastern Europeans | 100.0 /100 | #35 | Exceptional 1.6% |
| Aleuts | 99.9 /100 | #36 | Exceptional 1.6% |
| Belgians | 99.9 /100 | #37 | Exceptional 1.6% |
| Northern Europeans | 99.9 /100 | #38 | Exceptional 1.6% |
| Native Hawaiians | 99.9 /100 | #39 | Exceptional 1.6% |
| Luxembourgers | 99.9 /100 | #40 | Exceptional 1.6% |
| Hungarians | 99.9 /100 | #41 | Exceptional 1.6% |
| Bulgarians | 99.9 /100 | #42 | Exceptional 1.6% |
| Australians | 99.9 /100 | #43 | Exceptional 1.6% |
| Estonians | 99.9 /100 | #44 | Exceptional 1.6% |
| Czechoslovakians | 99.9 /100 | #45 | Exceptional 1.6% |
| Maltese | 99.9 /100 | #46 | Exceptional 1.6% |