Immigrants from Yemen vs Macedonian High School Diploma
COMPARE
Immigrants from Yemen
Macedonian
High School Diploma
High School Diploma Comparison
Immigrants from Yemen
Macedonians
81.8%
HIGH SCHOOL DIPLOMA
0.0/ 100
METRIC RATING
337th/ 347
METRIC RANK
91.1%
HIGH SCHOOL DIPLOMA
99.7/ 100
METRIC RATING
54th/ 347
METRIC RANK
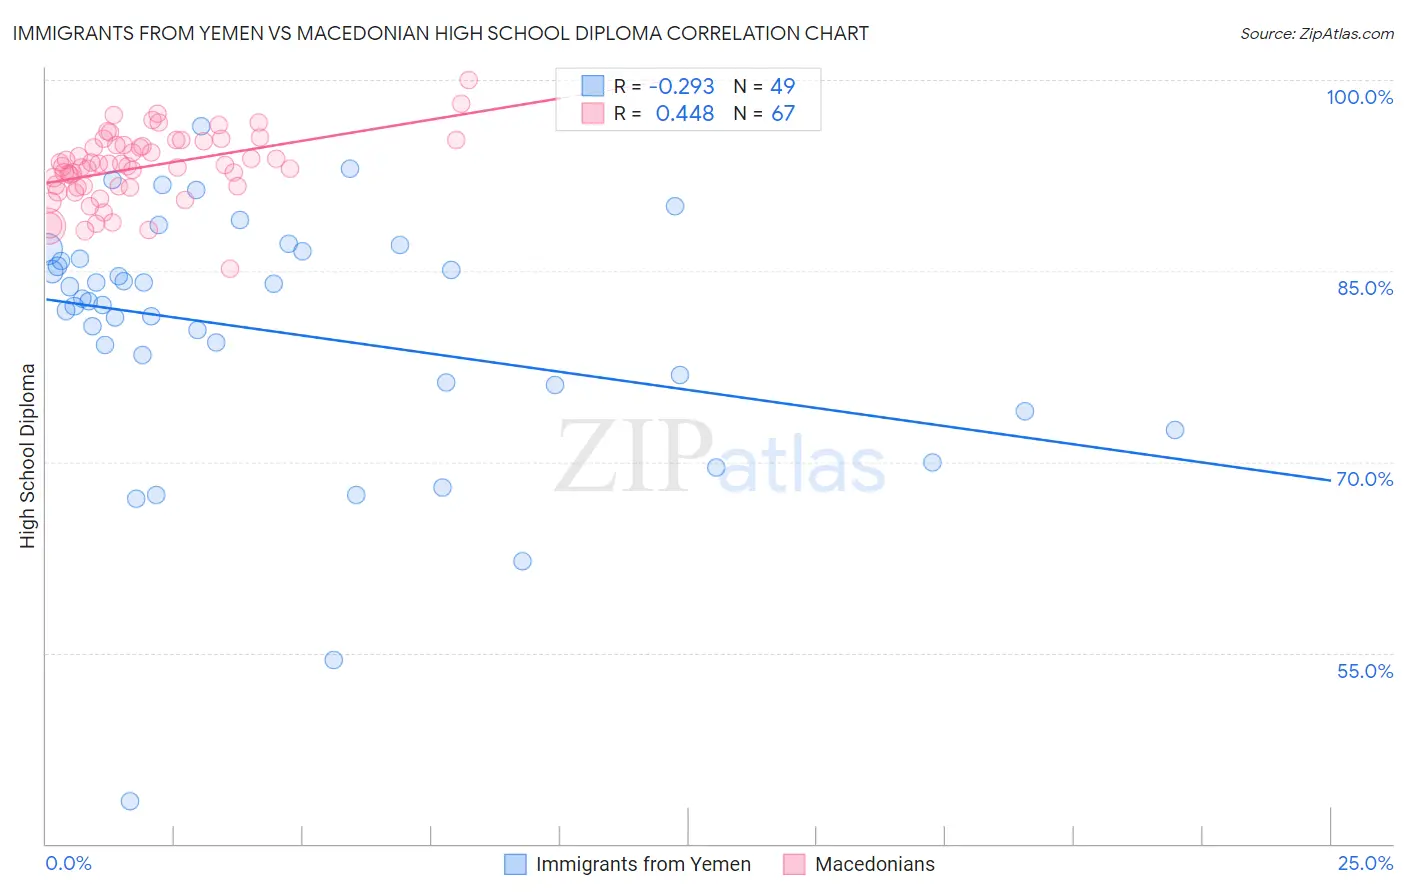
Immigrants from Yemen vs Macedonian High School Diploma Correlation Chart
The statistical analysis conducted on geographies consisting of 82,429,885 people shows a weak negative correlation between the proportion of Immigrants from Yemen and percentage of population with at least high school diploma education in the United States with a correlation coefficient (R) of -0.293 and weighted average of 81.8%. Similarly, the statistical analysis conducted on geographies consisting of 132,645,902 people shows a moderate positive correlation between the proportion of Macedonians and percentage of population with at least high school diploma education in the United States with a correlation coefficient (R) of 0.448 and weighted average of 91.1%, a difference of 11.3%.
High School Diploma Correlation Summary
| Measurement | Immigrants from Yemen | Macedonian |
| Minimum | 43.3% | 85.2% |
| Maximum | 96.4% | 100.0% |
| Range | 53.1% | 14.8% |
| Mean | 80.2% | 93.2% |
| Median | 82.6% | 93.3% |
| Interquartile 25% (IQ1) | 76.1% | 91.7% |
| Interquartile 75% (IQ3) | 86.2% | 95.1% |
| Interquartile Range (IQR) | 10.1% | 3.5% |
| Standard Deviation (Sample) | 10.1% | 2.7% |
| Standard Deviation (Population) | 10.0% | 2.7% |
Similar Demographics by High School Diploma
Demographics Similar to Immigrants from Yemen by High School Diploma
In terms of high school diploma, the demographic groups most similar to Immigrants from Yemen are Guatemalan (82.0%, a difference of 0.15%), Immigrants from Dominican Republic (82.0%, a difference of 0.15%), Salvadoran (81.7%, a difference of 0.17%), Tohono O'odham (82.1%, a difference of 0.27%), and Pima (81.6%, a difference of 0.27%).
| Demographics | Rating | Rank | High School Diploma |
| Immigrants | Azores | 0.0 /100 | #330 | Tragic 82.8% |
| Central Americans | 0.0 /100 | #331 | Tragic 82.5% |
| Immigrants | Honduras | 0.0 /100 | #332 | Tragic 82.5% |
| Immigrants | Latin America | 0.0 /100 | #333 | Tragic 82.1% |
| Tohono O'odham | 0.0 /100 | #334 | Tragic 82.1% |
| Guatemalans | 0.0 /100 | #335 | Tragic 82.0% |
| Immigrants | Dominican Republic | 0.0 /100 | #336 | Tragic 82.0% |
| Immigrants | Yemen | 0.0 /100 | #337 | Tragic 81.8% |
| Salvadorans | 0.0 /100 | #338 | Tragic 81.7% |
| Pima | 0.0 /100 | #339 | Tragic 81.6% |
| Houma | 0.0 /100 | #340 | Tragic 81.5% |
| Mexicans | 0.0 /100 | #341 | Tragic 81.4% |
| Immigrants | Guatemala | 0.0 /100 | #342 | Tragic 81.4% |
| Immigrants | El Salvador | 0.0 /100 | #343 | Tragic 80.8% |
| Immigrants | Central America | 0.0 /100 | #344 | Tragic 80.1% |
Demographics Similar to Macedonians by High School Diploma
In terms of high school diploma, the demographic groups most similar to Macedonians are Serbian (91.1%, a difference of 0.010%), New Zealander (91.1%, a difference of 0.020%), Immigrants from Sweden (91.1%, a difference of 0.020%), Immigrants from Belgium (91.1%, a difference of 0.020%), and Immigrants from Canada (91.1%, a difference of 0.040%).
| Demographics | Rating | Rank | High School Diploma |
| Australians | 99.8 /100 | #47 | Exceptional 91.2% |
| Belgians | 99.8 /100 | #48 | Exceptional 91.2% |
| Bhutanese | 99.8 /100 | #49 | Exceptional 91.2% |
| Welsh | 99.8 /100 | #50 | Exceptional 91.2% |
| New Zealanders | 99.7 /100 | #51 | Exceptional 91.1% |
| Immigrants | Sweden | 99.7 /100 | #52 | Exceptional 91.1% |
| Immigrants | Belgium | 99.7 /100 | #53 | Exceptional 91.1% |
| Macedonians | 99.7 /100 | #54 | Exceptional 91.1% |
| Serbians | 99.7 /100 | #55 | Exceptional 91.1% |
| Immigrants | Canada | 99.7 /100 | #56 | Exceptional 91.1% |
| Zimbabweans | 99.7 /100 | #57 | Exceptional 91.1% |
| Slavs | 99.7 /100 | #58 | Exceptional 91.0% |
| Immigrants | North America | 99.7 /100 | #59 | Exceptional 91.0% |
| Immigrants | Japan | 99.6 /100 | #60 | Exceptional 91.0% |
| Immigrants | Taiwan | 99.6 /100 | #61 | Exceptional 91.0% |