Immigrants from Czechoslovakia vs Macedonian High School Diploma
COMPARE
Immigrants from Czechoslovakia
Macedonian
High School Diploma
High School Diploma Comparison
Immigrants from Czechoslovakia
Macedonians
90.9%
HIGH SCHOOL DIPLOMA
99.4/ 100
METRIC RATING
74th/ 347
METRIC RANK
91.1%
HIGH SCHOOL DIPLOMA
99.7/ 100
METRIC RATING
54th/ 347
METRIC RANK
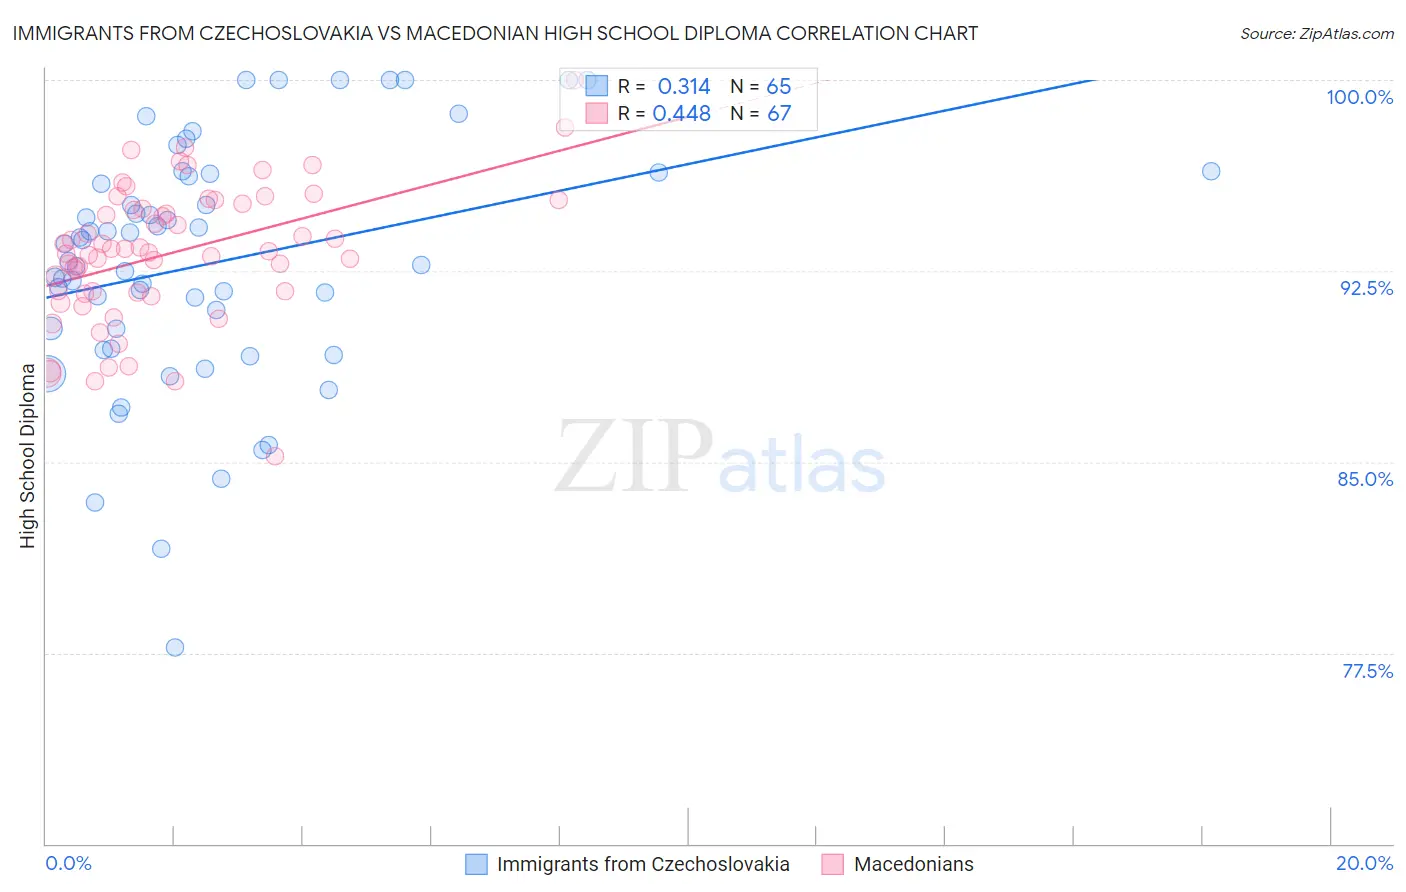
Immigrants from Czechoslovakia vs Macedonian High School Diploma Correlation Chart
The statistical analysis conducted on geographies consisting of 195,448,106 people shows a mild positive correlation between the proportion of Immigrants from Czechoslovakia and percentage of population with at least high school diploma education in the United States with a correlation coefficient (R) of 0.314 and weighted average of 90.9%. Similarly, the statistical analysis conducted on geographies consisting of 132,645,902 people shows a moderate positive correlation between the proportion of Macedonians and percentage of population with at least high school diploma education in the United States with a correlation coefficient (R) of 0.448 and weighted average of 91.1%, a difference of 0.29%.
High School Diploma Correlation Summary
| Measurement | Immigrants from Czechoslovakia | Macedonian |
| Minimum | 77.7% | 85.2% |
| Maximum | 100.0% | 100.0% |
| Range | 22.3% | 14.8% |
| Mean | 92.8% | 93.2% |
| Median | 92.9% | 93.3% |
| Interquartile 25% (IQ1) | 89.8% | 91.7% |
| Interquartile 75% (IQ3) | 96.3% | 95.1% |
| Interquartile Range (IQR) | 6.4% | 3.5% |
| Standard Deviation (Sample) | 4.8% | 2.7% |
| Standard Deviation (Population) | 4.7% | 2.7% |
Demographics Similar to Immigrants from Czechoslovakia and Macedonians by High School Diploma
In terms of high school diploma, the demographic groups most similar to Immigrants from Czechoslovakia are Immigrants from South Central Asia (90.9%, a difference of 0.010%), French Canadian (90.9%, a difference of 0.040%), Immigrants from Latvia (90.9%, a difference of 0.040%), Alaskan Athabascan (90.9%, a difference of 0.040%), and Soviet Union (90.9%, a difference of 0.040%). Similarly, the demographic groups most similar to Macedonians are Serbian (91.1%, a difference of 0.010%), Immigrants from Canada (91.1%, a difference of 0.040%), Zimbabwean (91.1%, a difference of 0.060%), Slavic (91.0%, a difference of 0.070%), and Immigrants from North America (91.0%, a difference of 0.070%).
| Demographics | Rating | Rank | High School Diploma |
| Macedonians | 99.7 /100 | #54 | Exceptional 91.1% |
| Serbians | 99.7 /100 | #55 | Exceptional 91.1% |
| Immigrants | Canada | 99.7 /100 | #56 | Exceptional 91.1% |
| Zimbabweans | 99.7 /100 | #57 | Exceptional 91.1% |
| Slavs | 99.7 /100 | #58 | Exceptional 91.0% |
| Immigrants | North America | 99.7 /100 | #59 | Exceptional 91.0% |
| Immigrants | Japan | 99.6 /100 | #60 | Exceptional 91.0% |
| Immigrants | Taiwan | 99.6 /100 | #61 | Exceptional 91.0% |
| Austrians | 99.6 /100 | #62 | Exceptional 91.0% |
| Immigrants | Netherlands | 99.6 /100 | #63 | Exceptional 91.0% |
| Ukrainians | 99.6 /100 | #64 | Exceptional 91.0% |
| Immigrants | South Africa | 99.6 /100 | #65 | Exceptional 91.0% |
| French | 99.5 /100 | #66 | Exceptional 91.0% |
| Immigrants | Iran | 99.5 /100 | #67 | Exceptional 90.9% |
| Czechoslovakians | 99.5 /100 | #68 | Exceptional 90.9% |
| French Canadians | 99.5 /100 | #69 | Exceptional 90.9% |
| Immigrants | Latvia | 99.5 /100 | #70 | Exceptional 90.9% |
| Alaskan Athabascans | 99.4 /100 | #71 | Exceptional 90.9% |
| Soviet Union | 99.4 /100 | #72 | Exceptional 90.9% |
| Immigrants | South Central Asia | 99.4 /100 | #73 | Exceptional 90.9% |
| Immigrants | Czechoslovakia | 99.4 /100 | #74 | Exceptional 90.9% |