Liberian vs Immigrants from Zimbabwe In Labor Force | Age 20-64
COMPARE
Liberian
Immigrants from Zimbabwe
In Labor Force | Age 20-64
In Labor Force | Age 20-64 Comparison
Liberians
Immigrants from Zimbabwe
80.9%
IN LABOR FORCE | AGE 20-64
100.0/ 100
METRIC RATING
21st/ 347
METRIC RANK
80.5%
IN LABOR FORCE | AGE 20-64
99.8/ 100
METRIC RATING
40th/ 347
METRIC RANK
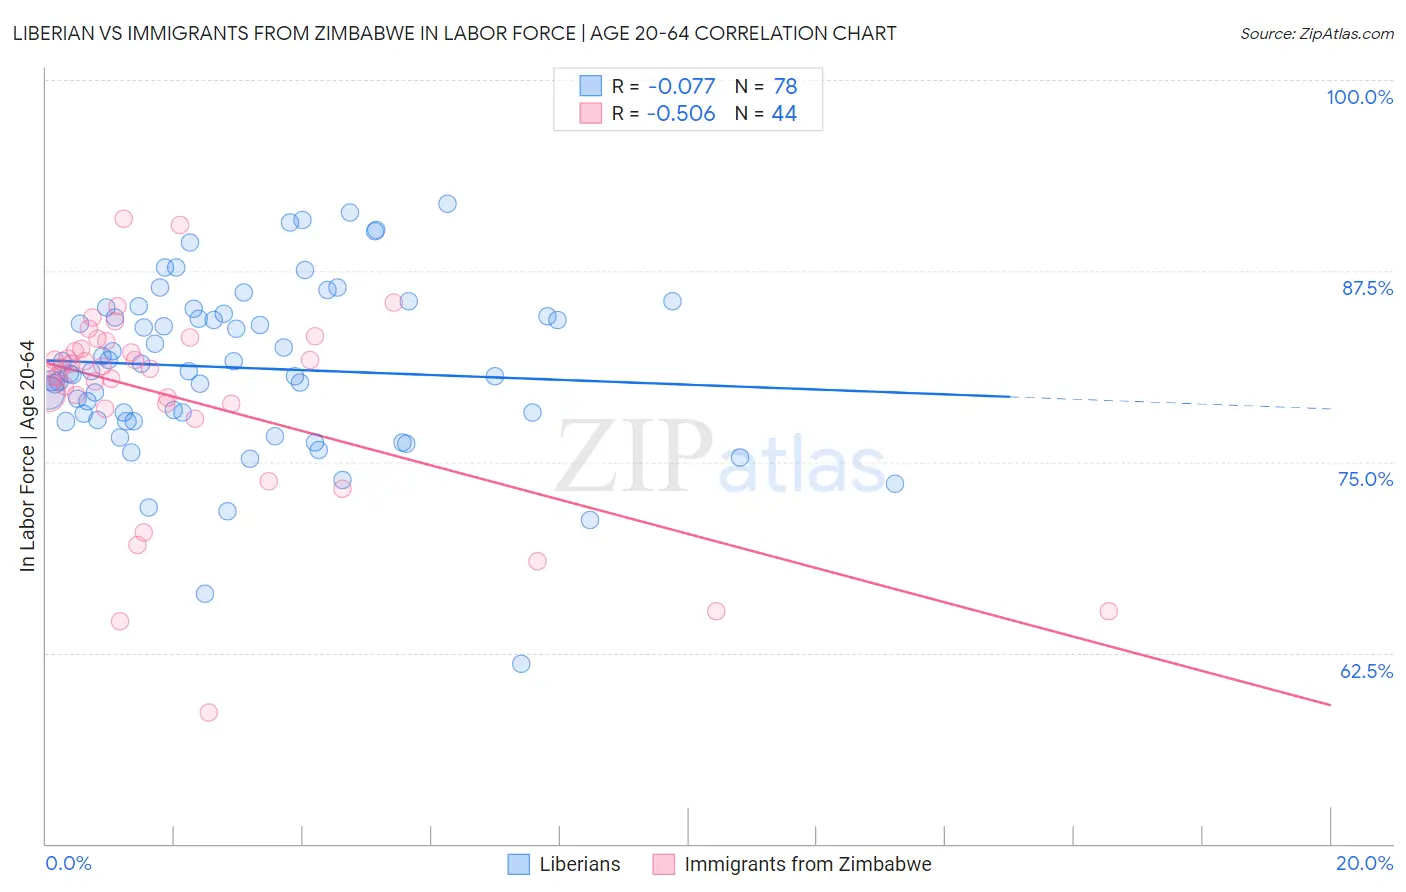
Liberian vs Immigrants from Zimbabwe In Labor Force | Age 20-64 Correlation Chart
The statistical analysis conducted on geographies consisting of 118,097,222 people shows a slight negative correlation between the proportion of Liberians and labor force participation rate among population between the ages 20 and 64 in the United States with a correlation coefficient (R) of -0.077 and weighted average of 80.9%. Similarly, the statistical analysis conducted on geographies consisting of 117,813,548 people shows a substantial negative correlation between the proportion of Immigrants from Zimbabwe and labor force participation rate among population between the ages 20 and 64 in the United States with a correlation coefficient (R) of -0.506 and weighted average of 80.5%, a difference of 0.44%.
In Labor Force | Age 20-64 Correlation Summary
| Measurement | Liberian | Immigrants from Zimbabwe |
| Minimum | 61.8% | 58.6% |
| Maximum | 91.9% | 90.9% |
| Range | 30.1% | 32.3% |
| Mean | 81.1% | 79.1% |
| Median | 80.9% | 81.1% |
| Interquartile 25% (IQ1) | 77.7% | 78.6% |
| Interquartile 75% (IQ3) | 84.7% | 82.7% |
| Interquartile Range (IQR) | 7.0% | 4.0% |
| Standard Deviation (Sample) | 5.6% | 6.7% |
| Standard Deviation (Population) | 5.5% | 6.6% |
Demographics Similar to Liberians and Immigrants from Zimbabwe by In Labor Force | Age 20-64
In terms of in labor force | age 20-64, the demographic groups most similar to Liberians are Thai (80.9%, a difference of 0.020%), Sudanese (80.8%, a difference of 0.070%), Immigrants from Bosnia and Herzegovina (80.8%, a difference of 0.080%), Immigrants from Morocco (80.8%, a difference of 0.090%), and Kenyan (80.8%, a difference of 0.10%). Similarly, the demographic groups most similar to Immigrants from Zimbabwe are Brazilian (80.5%, a difference of 0.0%), Ugandan (80.6%, a difference of 0.010%), Paraguayan (80.6%, a difference of 0.030%), Immigrants from Moldova (80.6%, a difference of 0.030%), and Immigrants from Poland (80.6%, a difference of 0.10%).
| Demographics | Rating | Rank | In Labor Force | Age 20-64 |
| Thais | 100.0 /100 | #20 | Exceptional 80.9% |
| Liberians | 100.0 /100 | #21 | Exceptional 80.9% |
| Sudanese | 100.0 /100 | #22 | Exceptional 80.8% |
| Immigrants | Bosnia and Herzegovina | 100.0 /100 | #23 | Exceptional 80.8% |
| Immigrants | Morocco | 100.0 /100 | #24 | Exceptional 80.8% |
| Kenyans | 100.0 /100 | #25 | Exceptional 80.8% |
| Immigrants | Serbia | 100.0 /100 | #26 | Exceptional 80.8% |
| Immigrants | Kenya | 99.9 /100 | #27 | Exceptional 80.7% |
| Immigrants | Uganda | 99.9 /100 | #28 | Exceptional 80.7% |
| Immigrants | South Central Asia | 99.9 /100 | #29 | Exceptional 80.7% |
| Immigrants | North Macedonia | 99.9 /100 | #30 | Exceptional 80.7% |
| Immigrants | Lithuania | 99.9 /100 | #31 | Exceptional 80.7% |
| Immigrants | Ireland | 99.9 /100 | #32 | Exceptional 80.7% |
| Chinese | 99.9 /100 | #33 | Exceptional 80.7% |
| Immigrants | Brazil | 99.9 /100 | #34 | Exceptional 80.7% |
| Immigrants | Poland | 99.9 /100 | #35 | Exceptional 80.6% |
| Paraguayans | 99.8 /100 | #36 | Exceptional 80.6% |
| Immigrants | Moldova | 99.8 /100 | #37 | Exceptional 80.6% |
| Ugandans | 99.8 /100 | #38 | Exceptional 80.6% |
| Brazilians | 99.8 /100 | #39 | Exceptional 80.5% |
| Immigrants | Zimbabwe | 99.8 /100 | #40 | Exceptional 80.5% |