Liberian vs Fijian Median Male Earnings
COMPARE
Liberian
Fijian
Median Male Earnings
Median Male Earnings Comparison
Liberians
Fijians
$49,318
MEDIAN MALE EARNINGS
0.6/ 100
METRIC RATING
261st/ 347
METRIC RANK
$45,607
MEDIAN MALE EARNINGS
0.0/ 100
METRIC RATING
321st/ 347
METRIC RANK
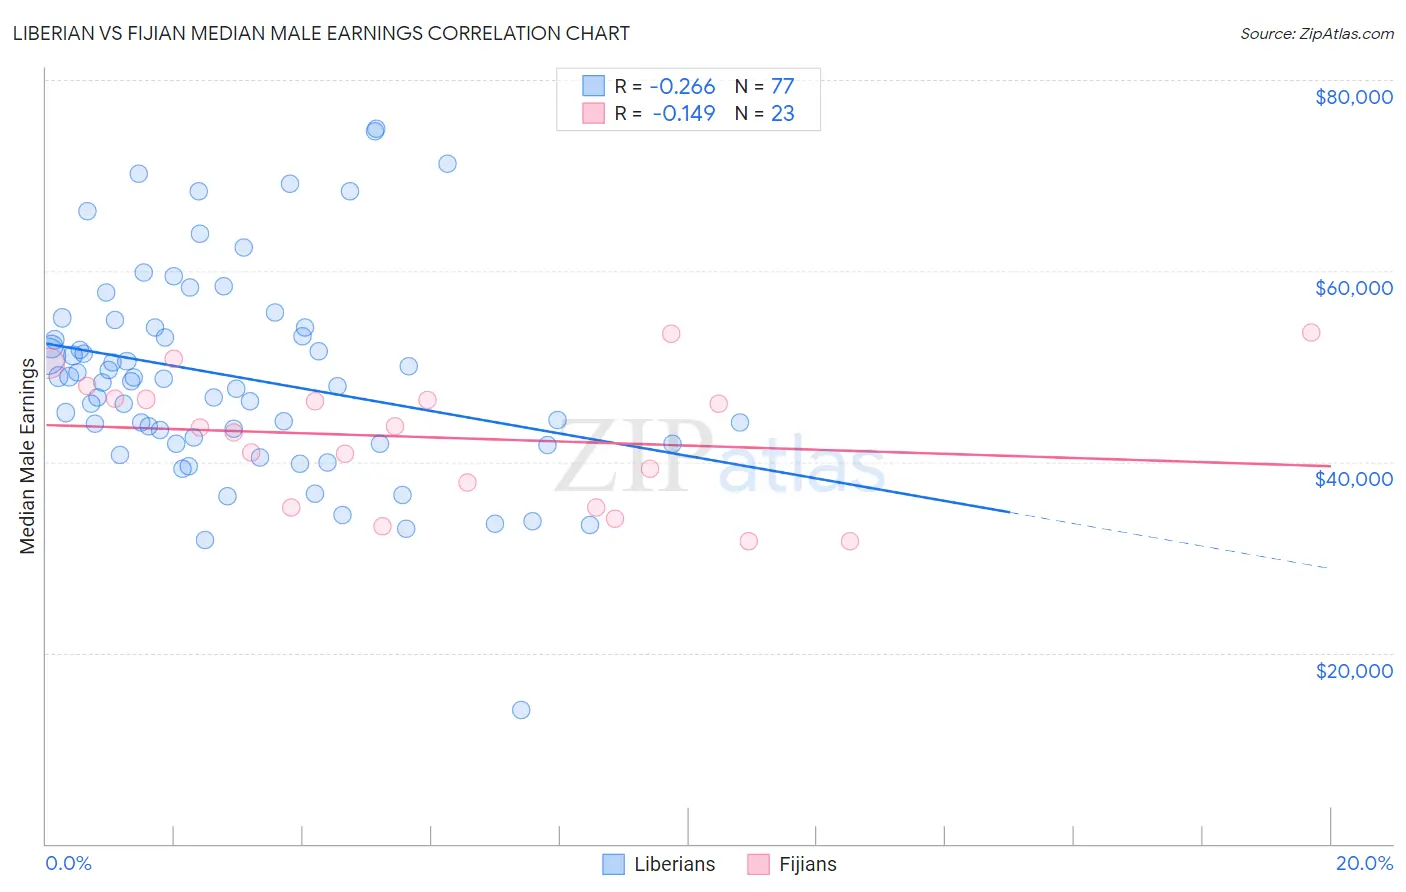
Liberian vs Fijian Median Male Earnings Correlation Chart
The statistical analysis conducted on geographies consisting of 118,095,267 people shows a weak negative correlation between the proportion of Liberians and median male earnings in the United States with a correlation coefficient (R) of -0.266 and weighted average of $49,318. Similarly, the statistical analysis conducted on geographies consisting of 55,945,280 people shows a poor negative correlation between the proportion of Fijians and median male earnings in the United States with a correlation coefficient (R) of -0.149 and weighted average of $45,607, a difference of 8.1%.
Median Male Earnings Correlation Summary
| Measurement | Liberian | Fijian |
| Minimum | $14,075 | $31,736 |
| Maximum | $74,924 | $53,542 |
| Range | $60,849 | $21,806 |
| Mean | $48,884 | $42,546 |
| Median | $48,498 | $43,625 |
| Interquartile 25% (IQ1) | $41,872 | $35,286 |
| Interquartile 75% (IQ3) | $54,038 | $46,656 |
| Interquartile Range (IQR) | $12,166 | $11,370 |
| Standard Deviation (Sample) | $10,904 | $6,788 |
| Standard Deviation (Population) | $10,833 | $6,639 |
Similar Demographics by Median Male Earnings
Demographics Similar to Liberians by Median Male Earnings
In terms of median male earnings, the demographic groups most similar to Liberians are Immigrants from West Indies ($49,271, a difference of 0.10%), Iroquois ($49,374, a difference of 0.11%), Nicaraguan ($49,215, a difference of 0.21%), Immigrants from Middle Africa ($49,201, a difference of 0.24%), and Immigrants from Laos ($49,190, a difference of 0.26%).
| Demographics | Rating | Rank | Median Male Earnings |
| Senegalese | 1.0 /100 | #254 | Tragic $49,774 |
| Alaskan Athabascans | 0.9 /100 | #255 | Tragic $49,748 |
| Alaska Natives | 0.9 /100 | #256 | Tragic $49,711 |
| British West Indians | 0.8 /100 | #257 | Tragic $49,636 |
| Cree | 0.7 /100 | #258 | Tragic $49,497 |
| Nepalese | 0.7 /100 | #259 | Tragic $49,458 |
| Iroquois | 0.7 /100 | #260 | Tragic $49,374 |
| Liberians | 0.6 /100 | #261 | Tragic $49,318 |
| Immigrants | West Indies | 0.6 /100 | #262 | Tragic $49,271 |
| Nicaraguans | 0.6 /100 | #263 | Tragic $49,215 |
| Immigrants | Middle Africa | 0.6 /100 | #264 | Tragic $49,201 |
| Immigrants | Laos | 0.6 /100 | #265 | Tragic $49,190 |
| Somalis | 0.5 /100 | #266 | Tragic $49,025 |
| Spanish Americans | 0.5 /100 | #267 | Tragic $49,008 |
| Ute | 0.4 /100 | #268 | Tragic $48,899 |
Demographics Similar to Fijians by Median Male Earnings
In terms of median male earnings, the demographic groups most similar to Fijians are Sioux ($45,566, a difference of 0.090%), Immigrants from Central America ($45,538, a difference of 0.15%), Black/African American ($45,523, a difference of 0.18%), Yuman ($45,446, a difference of 0.35%), and Immigrants from Honduras ($45,787, a difference of 0.39%).
| Demographics | Rating | Rank | Median Male Earnings |
| Chippewa | 0.0 /100 | #314 | Tragic $46,368 |
| Immigrants | Guatemala | 0.0 /100 | #315 | Tragic $46,244 |
| Immigrants | Caribbean | 0.0 /100 | #316 | Tragic $46,193 |
| Mexicans | 0.0 /100 | #317 | Tragic $46,147 |
| Cheyenne | 0.0 /100 | #318 | Tragic $46,062 |
| Haitians | 0.0 /100 | #319 | Tragic $45,903 |
| Immigrants | Honduras | 0.0 /100 | #320 | Tragic $45,787 |
| Fijians | 0.0 /100 | #321 | Tragic $45,607 |
| Sioux | 0.0 /100 | #322 | Tragic $45,566 |
| Immigrants | Central America | 0.0 /100 | #323 | Tragic $45,538 |
| Blacks/African Americans | 0.0 /100 | #324 | Tragic $45,523 |
| Yuman | 0.0 /100 | #325 | Tragic $45,446 |
| Immigrants | Haiti | 0.0 /100 | #326 | Tragic $45,266 |
| Immigrants | Bahamas | 0.0 /100 | #327 | Tragic $45,176 |
| Kiowa | 0.0 /100 | #328 | Tragic $45,094 |